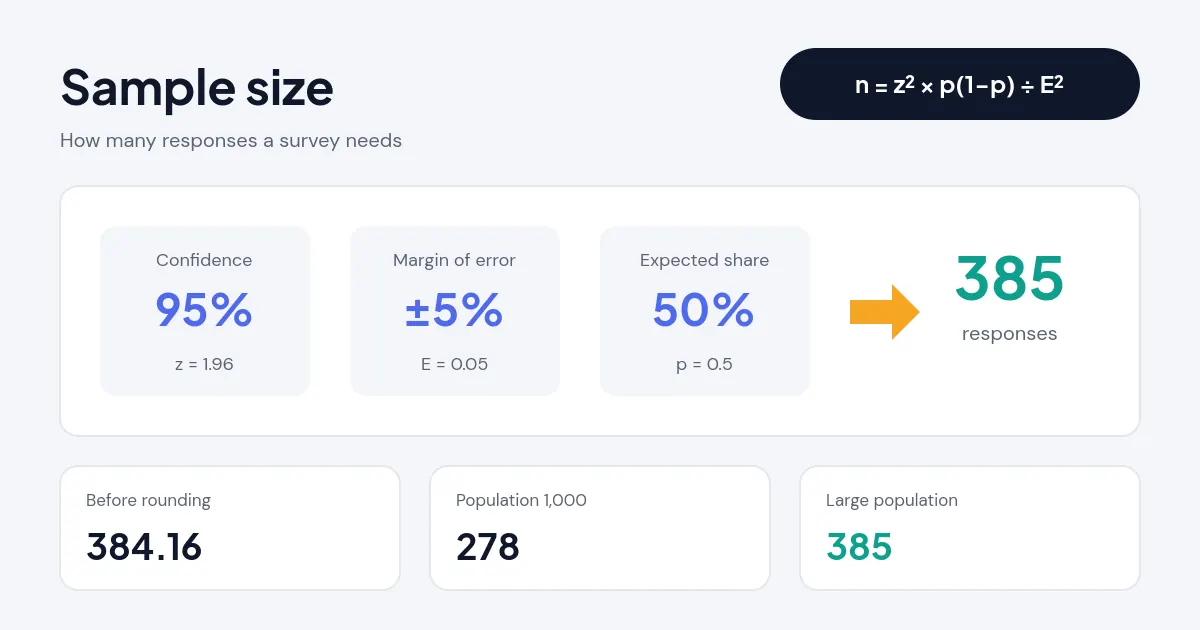
Quick answer: For a survey, the sample size formula is n = z² × p(1 − p) ÷ E². At 95% confidence (z = 1.96), a ±5% margin of error and p = 50%, you need 385 completed responses. This sample size calculator also corrects for small populations, so a group of 1,000 people needs only 278.
Why Does Sample Size Matter?
A sample size calculator tells you how many people, items or measurements you need so that your result is within a chosen margin of error at a chosen confidence level. Ask too few people and a poll that shows 52% support could really be anywhere from 42% to 62%. Ask far too many and you waste budget for precision nobody needs.
This calculator covers the three questions researchers actually ask. Survey percentage finds the sample for estimating a proportion, such as the share of customers who would recommend you. Average finds the sample for estimating a mean, such as average delivery time, when you know roughly how spread out the values are. Margin of error works backwards: you already have the responses and want to know how precise the result is. It also applies the finite population correction for small groups and turns a response rate into the number of invitations to send.
How Do You Set Confidence, Margin and Population?
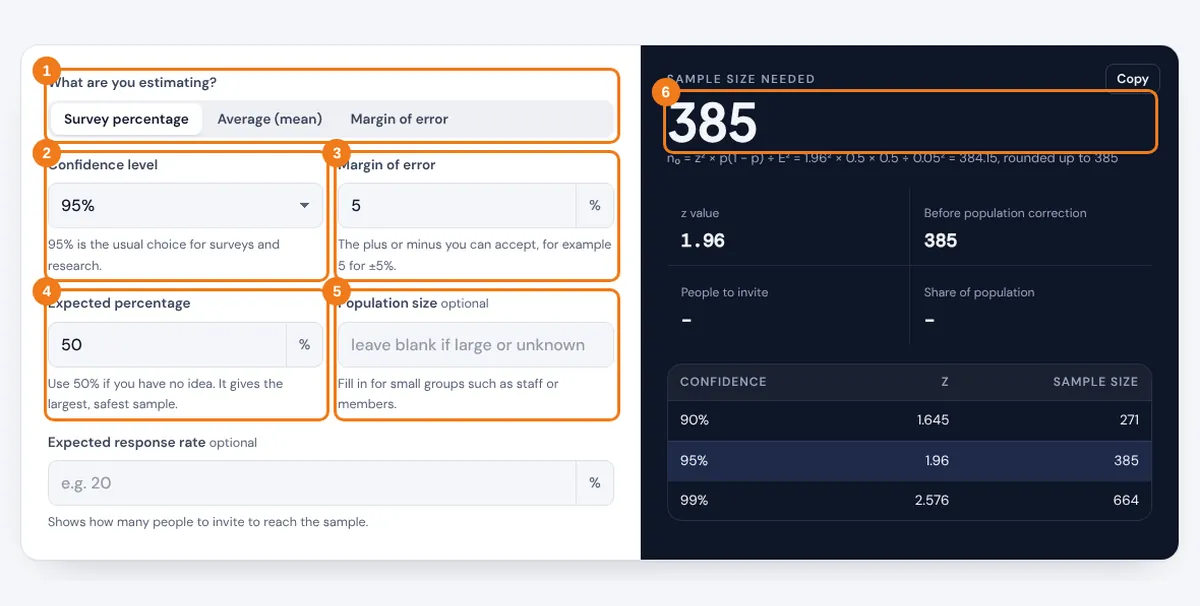
- Choose survey percentage, average or margin of error, depending on what you are measuring.
- Pick a confidence level. 95% is the standard for most surveys and studies.
- Enter the margin of error you can accept, for example 5 for plus or minus 5 points.
- Enter the expected percentage, or 50% if you do not know, or the standard deviation for an average.
- Add the population size if it is small, and a response rate if you want the number of people to invite.
- Read the sample size, the z value and the comparison table for 90%, 95% and 99% confidence.
The answer is always rounded up, because rounding down would leave you slightly short of the precision you asked for.
What Is the Sample Size Formula?
The sample size formula for a proportion multiplies the squared z value by the variance p(1 − p) and divides by the squared margin of error. For a mean, the variance is replaced by the standard deviation squared.
Mean: n₀ = (z × σ ÷ E)²
Finite population correction: n = n₀ ÷ (1 + (n₀ − 1) ÷ N)
Margin of error from n: E = z × √(p(1 − p) ÷ n)
Worked example: a school with 1,000 parents wants their view on a new timetable, ±5% at 95% confidence. With p = 0.5, n₀ = 1.96² × 0.25 ÷ 0.05² = 3.8416 × 0.25 ÷ 0.0025 = 384.16. The correction gives 384.16 ÷ (1 + 383.16 ÷ 1,000) = 277.7, so the school needs 278 replies. The calculator uses the unrounded z of 1.959964, so it shows 384.15 before rounding; either way the answer rounds up to the same sample. If it expects 40% of parents to answer, it should send the survey to 278 ÷ 0.40 = 695 parents.
Mean example: a clinic wants average wait time within ±3 minutes at 95% confidence, and past data show a standard deviation of 15 minutes. n = (1.96 × 15 ÷ 3)² = 9.8² = 96.04, which rounds up to 97 visits. The NIST Engineering Statistics Handbook section on required sample sizes derives this formula and explains when to use a t value instead.
How Many Responses Do You Need?

| Margin of error | 90% confidence | 95% confidence | 99% confidence |
|---|---|---|---|
| ±1% | 6,764 | 9,604 | 16,588 |
| ±2% | 1,691 | 2,401 | 4,147 |
| ±3% | 752 | 1,068 | 1,844 |
| ±4% | 423 | 601 | 1,037 |
| ±5% | 271 | 385 | 664 |
| ±10% | 68 | 97 | 166 |
These figures assume a large population and p = 50%. That is why national polls in the United States usually interview around 1,000 adults: it gives roughly ±3% at 95% confidence, and going much further costs a lot for little gain. The z values in the table come from the standard normal curve, and you can explore them with the z score calculator.
How Do You Choose the Inputs?
Confidence level
Confidence is how often the method would capture the true value if you repeated the survey many times. 95% is the convention. Use 90% for quick internal checks and 99% when a wrong decision is expensive, such as safety testing.
Margin of error
Pick the smallest difference that would change your decision. If you only need to know whether a majority agrees, ±5% is often enough. If you are comparing two groups that may differ by a few points, you need ±2% or better, or a dedicated power calculation.
Expected percentage and standard deviation
p(1 − p) is largest at 50%, so 50% is the safe default. If a past survey found that about 20% of people agree, using 20% lowers the sample from 385 to 246. For averages, take the standard deviation from a pilot study or earlier data using the standard deviation calculator.
Population size
The population only matters when your sample is a noticeable share of it, roughly more than 5%. For a city, a country or a customer base in the tens of thousands, leave it blank. Remember that the formula assumes a random sample; a large but self-selected sample can still be biased.
Related Tools
- Z Score Calculator
- Standard Deviation Calculator
- T Table Calculator
- Average Calculator
- Percent Error Calculator
Frequently asked questions
How do you calculate sample size?
Square the z value for your confidence level, multiply by p(1 − p), and divide by the squared margin of error. At 95% confidence and ±5% with p = 0.5 this gives 384.16, so you need 385 responses.
Why use 50% as the expected percentage?
The term p(1 − p) is largest when p is 50%, so it gives the biggest sample. That guarantees your margin of error whatever the true answer turns out to be.
Does population size change the sample size?
Only for small populations. For 1,000 people you need 278 instead of 385, but for 100,000 people you still need 383, almost the same as for an unlimited population.
What is a good sample size for a survey?
For most general surveys, 385 responses give ±5% at 95% confidence and about 1,000 give ±3%. Smaller groups need fewer, and subgroups you plan to analyze separately each need their own sample.
How many people should I invite?
Divide the sample size by the expected response rate. If you need 385 replies and expect 20% of people to answer, invite at least 1,925.
What is the margin of error for 1,000 responses?
At 95% confidence and p = 50%, it is about ±3.1%. With 400 responses it is about ±4.9%.