How to Use the Line of Best Fit Calculator
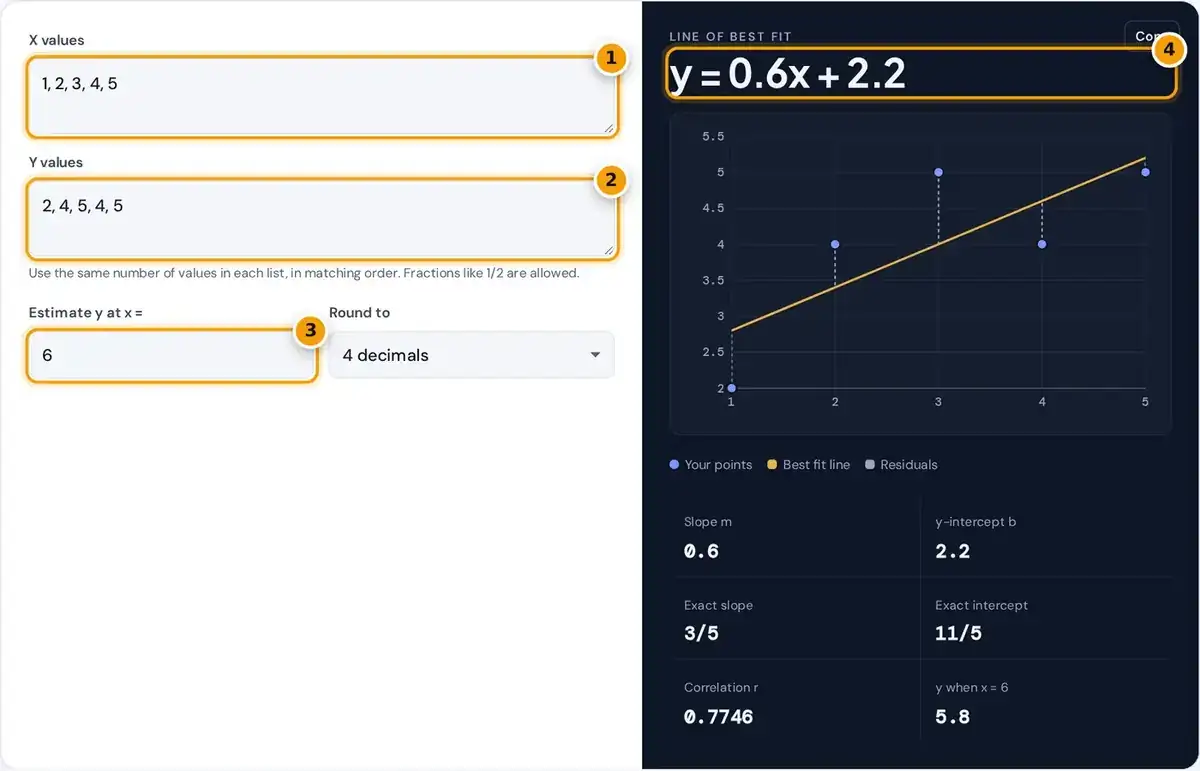
- Enter the x values, separated by commas or spaces.
- Enter the matching y values in the same order.
- Type an x value to estimate its y on the line.
- Read the equation y = mx + b, then the exact fractions, r, chart and steps.
Type your x values in the first input box and the matching y values in the second one, separated by commas or by spaces. Fractions such as 1/2, decimals and negative numbers are all accepted.
The calculator finds the least squares line, writes it as y = mx + b and draws it on a chart through your points, with each residual shown as a dashed gray line from point to line.
Enter an x value to estimate y, and choose 2, 3 or 4 decimals for rounding. Below the tool, the step-by-step working and a full residual table let you check your homework line by line.
What Is a Line of Best Fit
A line of best fit, also called a trend line, is the straight line that best describes the pattern in a scatter plot. It may pass through all, some or even none of the points.
The least squares method picks the one line that makes the total of the squared vertical distances from the points to the line as small as possible. No other straight line gives a smaller total.
The result is written in slope-intercept form, y = mx + b. It is exactly the same line produced by simple linear regression, the method the NIST Engineering Statistics Handbook calls the most widely used modeling method.
Line of Best Fit Formula
The slope comes from how x and y move together. Multiply each pair of deviations from the means, add them all up, then divide by the sum of the squared x deviations from the mean.
b = ȳ − m x̄
Residual = y − (mx + b)
Here x-bar and y-bar are the means of the x values and y values. The y-intercept b is the y-bar value minus the slope times x-bar, which is where the line crosses the y axis.
Because of this formula, the best fit line always passes through the mean point, the point made of both means. That makes it a handy check when you draw or calculate the line by hand.
Worked Example
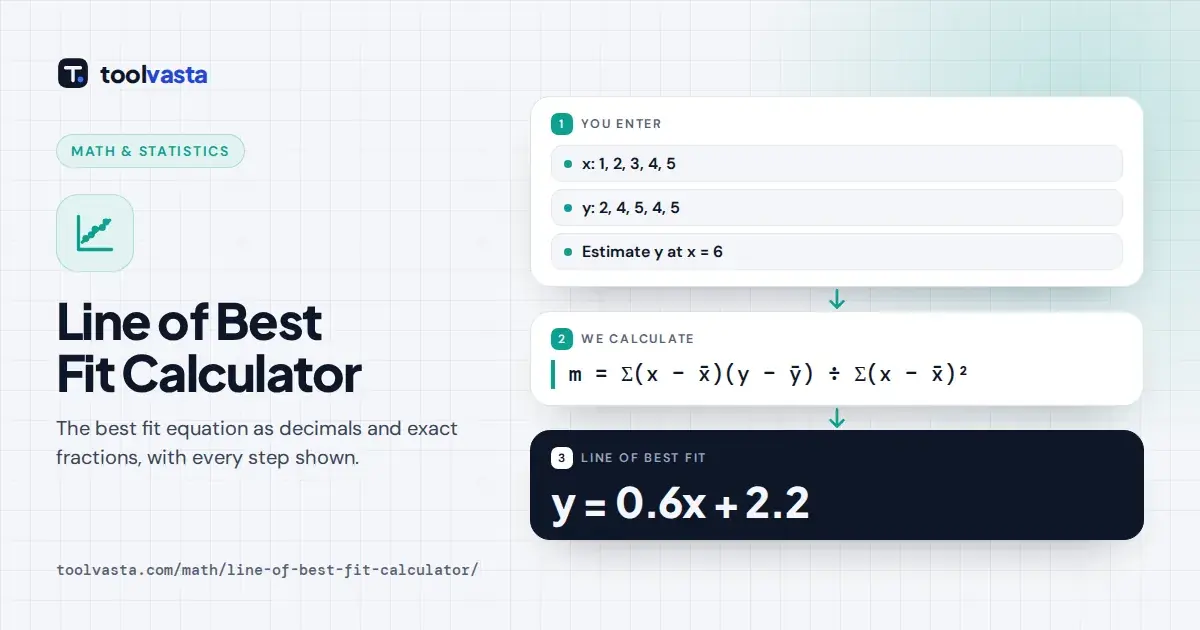
In this worked example, find the line of best fit for the points (1, 2), (2, 4), (3, 5), (4, 4) and (5, 5), which are the same values already loaded in the calculator above.
- Means: x-bar = 15 ÷ 5 = 3 and y-bar = 20 ÷ 5 = 4.
- Deviations: x − x-bar is −2, −1, 0, 1, 2 and y − y-bar is −2, 0, 1, 0, 1.
- Products add to 4 + 0 + 0 + 0 + 2 = 6.
- Squares add to 4 + 1 + 0 + 1 + 4 = 10.
- Slope: m = 6 ÷ 10 = 0.6.
- Intercept: b = 4 − 0.6 × 3 = 2.2.
The slope is exactly 3/5 and the intercept exactly 11/5, so the line of best fit is y = 0.6x + 2.2. At x = 6, the default value in the estimate box, the line predicts y = 5.8.
| x | y | Predicted | Residual |
|---|---|---|---|
| 1 | 2 | 2.8 | −0.8 |
| 2 | 4 | 3.4 | 0.6 |
| 3 | 5 | 4.0 | 1.0 |
| 4 | 4 | 4.6 | −0.6 |
| 5 | 5 | 5.2 | −0.2 |
The residuals add up to 0, which is always true for any fitted least squares line. Their squares add up to exactly 2.4, and no other straight line through these points gives a smaller total.
Correlation Coefficient and R Squared
The calculator result also reports the correlation coefficient r, a number from minus 1 to 1 that measures the strength and direction of a straight line relationship between the x values and the y values.
A value near 1 means points hug a line with a positive slope, and near minus 1 means a negative slope, where y falls as x rises. Values near 0 mean no straight line pattern.
For the worked example, r is about 0.775. Squaring it gives the coefficient of determination, R squared, of 0.6, so the line explains 60% of the variation in y, a moderate fit for five points.
What Residuals Tell You
A residual is the actual y value minus the predicted y value from the line. Positive residuals sit above the line and negative ones below it, as the dashed gray lines on the chart show.
If residuals look random, scattered both ways with no pattern, a straight line is a good model. If they curve, positive at both ends and negative in the middle, the data probably follows a curve.
One large residual can point to an outlier or a data entry mistake. The sum of squared residuals, shown in the table, is what least squares minimizes, as the Penn State STAT 501 notes explain.
Drawing a Line of Best Fit by Eye
In class you may be asked to sketch a trend line by eye before calculating it. Aim for a line with about the same number of points above and below it, running along the pattern.
Make your line pass through the mean point, then compare your sketch with the calculated line on the chart. A good sketch usually lands close to the true slope and intercept for fairly tidy data.
On a graphing calculator, enter the data in lists and use the LinReg function to get the same equation. This calculator adds the working, the residuals and exact fractions that a handheld screen rarely shows.
Limits and Extrapolation
Predictions inside the range of your x values are usually reasonable. Extrapolation, predicting far outside that range, is risky because the pattern may change, so treat any such estimates with real caution and common sense.
If every x value is the same, the best fit is a vertical line with no slope, and the calculator says so. A strong fit never proves causation between the two variables on its own.
The calculator uses exact fraction arithmetic and rounds only for display, so exact fraction results are reliable. For curved or nonlinear data, a straight line is simply the wrong model, however carefully you fit it.
Frequently asked questions
How do you calculate the line of best fit?
Find the means of x and y. The slope is the sum of the products of the deviations divided by the sum of squared x deviations, and the intercept is y-bar minus slope times x-bar.
Is the line of best fit the same as linear regression?
Yes. The least squares line of best fit is the simple linear regression line. This page focuses on the working and residuals, while a regression calculator also adds standard errors and a p-value.
Does the line of best fit have to go through the origin?
No. It always passes through the mean point, made of the mean of x and the mean of y, but it usually does not pass through the origin at (0, 0).
What does a residual mean?
A residual is the actual y value minus the y value predicted by the line. Positive residuals sit above the line and negative ones below it, and together they always sum to zero.
Can the line of best fit be vertical?
No. If every x value is the same, the slope is undefined and there is no y = mx + b line. The calculator shows a clear message when this happens.
What does R squared mean?
R squared is the share of the variation in y that the line explains, from 0 to 1. For a simple line of best fit it equals the correlation coefficient r squared.