How to Use the Average Calculator
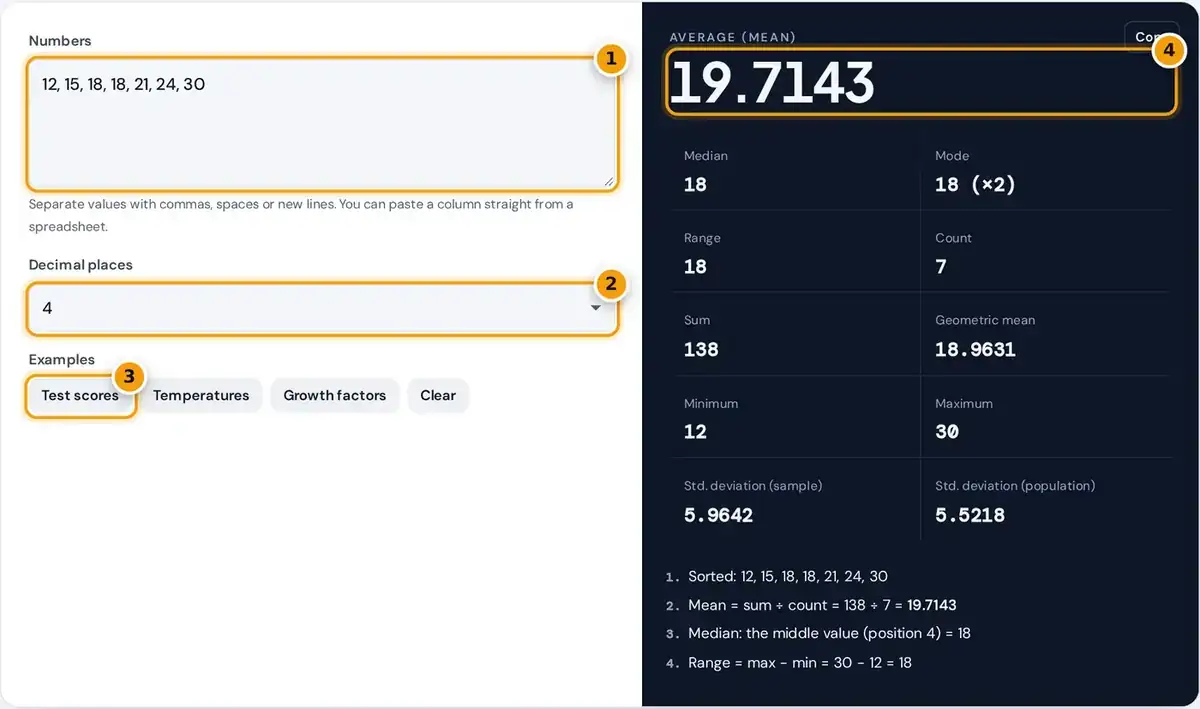
- Type or paste your numbers, separated by commas, spaces or new lines.
- Choose how many decimal places to show in the results.
- Or tap an example, such as Test scores, to see how it works.
- Read the mean, then the median, mode, range, standard deviation and steps below.
Type or paste your numbers into the box. You can separate them with commas, spaces, semicolons or line breaks, so a column copied straight from Excel or Google Sheets works without any cleanup at all.
The average calculator updates instantly on every single keystroke. It shows the mean, median, mode, range, count, sum, geometric mean, minimum, maximum and both standard deviations, plus the step-by-step working for the three main results.
Negative numbers and decimals are fine. Pick how many decimal places to show, from 2 to 8, and try the examples for test scores, temperatures and growth factors to see this average number calculator work.
Average Formula: Mean, Median and Mode
The word average usually means the arithmetic mean: the sum of all values divided by the count. The median and mode are the other two measures of central tendency, and each answers a different question.
Median = middle value of the sorted list (or the mean of the two middle values)
Mode = the value that appears most often
Range = maximum − minimum
Geometric mean = (x1 × x2 × … × xn)1/n
The median is the middle of the sorted list. With an even count, it is the mean of the two middle values. The mode is the value seen most often, and lists can have several.
The range is the maximum minus the minimum. It is quick to read but depends entirely on the two extreme values, so one unusual number can make a tightly grouped list look very widely scattered.
Worked Example: Seven Values
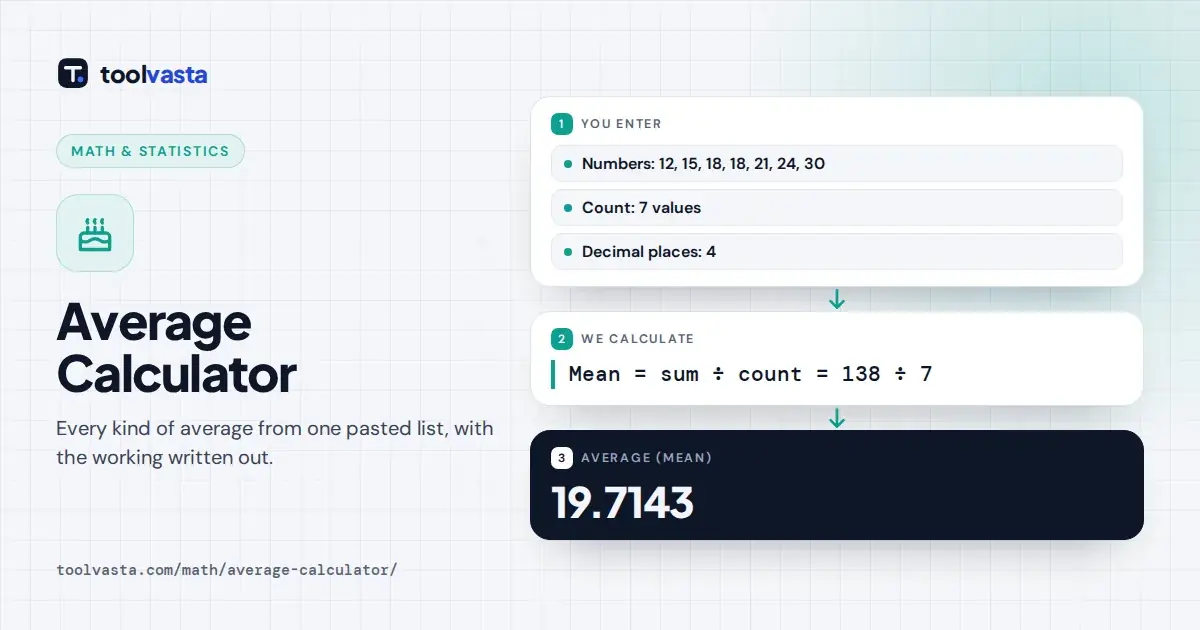
A worked example uses the seven values 12, 15, 18, 18, 21, 24 and 30. Their sum is 138, and dividing by the count of 7 gives a mean of 19.7143 to four decimal places.
- Median: the sorted list has 7 values, so the median is the 4th value, 18.
- Mode: 18 appears twice and every other value once, so the mode is 18.
- Range: 30 − 12 = 18.
- Geometric mean: the seventh root of the product, 18.9631.
- Standard deviation: 5.9642 (sample) and 5.5218 (population).
The list is already a sorted list, so the median is simply the middle value, 18. Because 18 appears twice, it is also the mode, and the calculator shows it with a count of two.
Notice that the mean of 19.7143 sits above the median of 18, because the value 30 pulls it upward. That small gap between them is a hint that the data leans slightly to the right.
Mean vs Median vs Mode: Which Average to Use
The mean uses every value, which makes it ideal for test scores and measurements. It is also very sensitive to outliers: one very large value drags it upward, while the median barely moves at all.
| Measure | Best for | Sensitive to outliers? |
|---|---|---|
| Mean | Test scores, measurements, most everyday averages | Yes |
| Median | House prices, incomes, skewed data | No |
| Mode | Most common shoe size, survey answers | No |
| Geometric mean | Growth rates, ratios, investment returns | Less than the mean |
That is why house prices and incomes, which are skewed data, are usually reported as medians. For the values 2, 3, 4, 5 and 100, the mean is 22.8 while the median is only 4.
The mode suits categories and survey answers, such as the most common shoe size. When the mean and median are close, the data is roughly symmetric, as the Statistics Canada guide to central tendency shows.
When to Use the Geometric Mean
Use the geometric mean for quantities that multiply rather than add, such as growth factors and investment returns. It takes the nth root of the product of the values, so it needs positive values only.
Load the growth factors example: 1.05, 1.12, 0.97 and 1.08. The geometric mean is about 1.0535, a steady compound growth of 5.35% a year that ends at exactly the same final value after four years.
The ordinary mean of those factors is 1.055, which overstates real growth. If any value is negative, the calculator reports that the geometric mean needs values of zero or more, rather than a misleading figure.
Weighted, Harmonic and Trimmed Averages
A weighted average lets some values count more than others, such as a final exam worth half the course grade. Multiply each value by its weight, add the results, then divide by the total weight.
The harmonic mean suits rates such as speeds over equal distances. Driving 60 km/h one way and 40 km/h back averages 48 km/h overall, not 50, because more time is spent at the slower speed.
A trimmed mean drops a set share of the highest and lowest values before averaging, which resists outliers. This tool covers the mean, median, mode and geometric mean; use the weighted average calculator for weights.
Standard Deviation, Variance and Spread
Standard deviation shows how far values typically sit from the mean. Variance is its square. A small standard deviation means a tightly grouped list, while a large one signals a wide spread around the average.
Use the sample version, which divides by n − 1, when your numbers are a sample from a larger group, such as a survey. Use the population version, dividing by n, when you have every value.
In the worked example above, the sample standard deviation is 5.9642 and the population standard deviation is 5.5218. The NIST statistics handbook explains measures of location and spread in much more depth, with worked examples.
Notes and Limits
A comma is always treated as a separator, so type large numbers without thousands separators: 12500, not 12,500. Otherwise the calculator reads 12 and 500 as two separate values and the resulting average changes completely.
Invalid entries such as words are flagged by name, so you can fix them quickly. The math uses ordinary double-precision arithmetic, accurate to about 15 significant digits, which is plenty for all everyday statistics work.
Results are only as good as the data. Always check for typing errors and accidentally duplicated rows, and consider whether an outlier is a real observation or a mistake before deciding which average to report.
Frequently asked questions
How do I calculate the average of a set of numbers?
Add all the numbers together and divide by how many numbers there are. For 4, 8 and 9 the sum is 21 and there are 3 values, so the average is 7.
What is the difference between mean and average?
In everyday use they mean the same thing: the arithmetic mean. Strictly, average is a general word that can also refer to the median, the mode or another measure of central tendency.
What if there are two modes?
A list can have more than one mode. The calculator lists every value that shares the highest count. If every value appears only once, there is no mode to report.
How do I find the median of an even number of values?
Sort the values and take the mean of the two middle values. For 3, 5, 7 and 9 the median is (5 + 7) divided by 2, which equals 6.
Can I paste numbers from Excel?
Yes. Copy a column or row of cells from Excel or Google Sheets and paste it into the box. Line breaks and tabs are treated as separators, so no cleanup is needed.
When should I use the median instead of the mean?
Use the median when the data is skewed or has outliers, such as incomes or house prices. The median shows the typical value, while the mean can be pulled far from it by extreme values.