How to Use the Baby Percentile Calculator
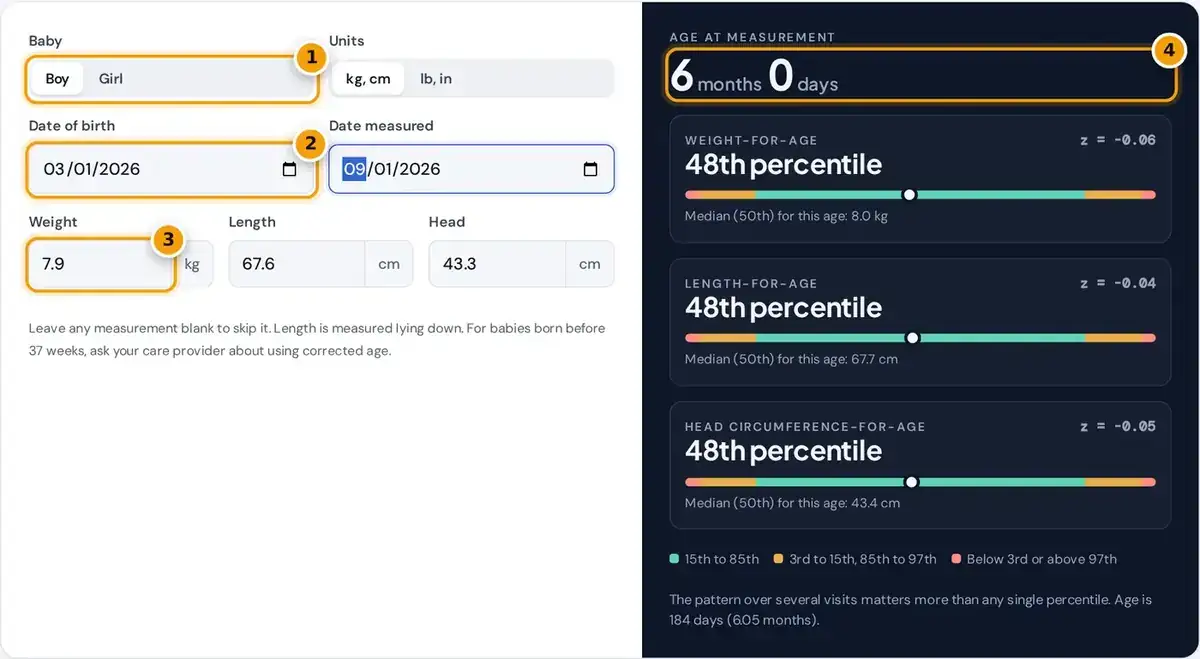
- Select boy or girl, since the WHO charts differ by sex.
- Enter your baby's date of birth and the date of the measurement.
- Enter weight, length and head circumference; leave any one blank to skip it.
- Check the age, then read each percentile and z-score against the WHO median.
Choose boy or girl first, then enter your baby's date of birth and the date measured. Add the weight, the length measured lying down and also the head circumference from your baby's most recent check-up.
Switch between kilograms with centimeters or pounds with inches, and leave any measurement blank to skip it. The calculator covers babies and toddlers from birth to 24 months of age, matching the WHO infant charts.
For each measurement you get the percentile, the z-score, a colored position on a track and the median for a baby of the same age and sex. A short note flags values that need attention.
What a Baby Percentile Means
A percentile compares your baby's measurement with a large reference group of healthy babies of the same age and sex. At the 60th percentile for weight, 60% of babies weigh less and 40% weigh more.
A higher percentile is not better and a lower one is not worse. Many healthy babies sit near the 10th or 90th percentile all through infancy simply because of genetics, feeding and their parents' size.
What health professionals really watch is steady growth along a similar growth curve over time. A sudden jump or drop across two major percentile lines is more meaningful than any single number on the chart.
How the Percentile Is Calculated
The WHO standards describe each measurement with three smoothed values for every age: L for skewness, M for the median and S for the coefficient of variation. This is the well-known LMS method used worldwide.
Percentile = Φ(z) × 100
Age in months = age in days / 30.4375
The calculator works out your baby's exact age in days, interpolates the monthly L, M and S values, then converts your measurement y into a single z-score using the formula above for that precise age.
The z-score counts standard deviations from the median, and the standard normal distribution function then turns it into a percentile. Beyond three z-scores either way, weight-for-age uses the WHO adjustment that keeps extreme values realistic.
Worked Example: A Six-Month-Old Boy
A boy born January 1 is measured on July 2, aged 6 months and 1 day. He weighs 8.5 kg against a median near 7.9 kg, which gives z = +0.64, the 74th percentile for weight-for-age.
His length of 70 cm gives z = +1.13, the 87th percentile for length-for-age. A head circumference of 44 cm lands on the 71st percentile for head circumference-for-age, all three sit well within the usual range.
For comparison, a girl measured at exactly 12 months with a weight of 8.2 kg and length of 72 cm sits on the 24th and 22nd percentiles. Both babies are growing normally for their sex.
WHO Median Values for Boys and Girls
The table lists selected WHO medians, the 50th percentile, for boys and girls. Use it for a quick sense of overall scale, and enter your baby's exact dates in the tool for a precise percentile.
| Age | Boys weight | Girls weight | Boys length | Girls length |
|---|---|---|---|---|
| Birth | 3.3 kg | 3.2 kg | 49.9 cm | 49.1 cm |
| 6 months | 7.9 kg | 7.3 kg | 67.6 cm | 65.7 cm |
| 12 months | 9.6 kg | 8.9 kg | 75.7 cm | 74.0 cm |
| 24 months | 12.2 kg | 11.5 kg | 87.8 cm | 86.4 cm |
Boys are slightly heavier and longer than girls at every age, which is why separate charts exist. Select Boy and the tool works as a boy growth chart canada calculator using the same WHO data.
Growth is fastest early. A typical boy more than doubles his birth weight by 6 months, from 3.3 kg to 7.9 kg, then gains more slowly until 24 months, when the median reaches 12.2 kg.
Growth Charts in Canada
Canada uses the WHO Growth Charts for Canada, adapted by Dietitians of Canada, the Canadian Paediatric Society and other national health groups. They rely on exactly the same WHO growth data that this calculator uses.
The WHO Child Growth Standards were built from healthy breastfed children in six countries, so they show how babies should grow. Canadian charts flag values below the 3rd or above the 97th percentile for follow-up.
CDC growth charts, used in the United States after age two, describe how a population actually grew. Percentiles can shift when a clinic changes chart type, so compare readings from the same chart over time.
Measuring at Home and When to Ask
For babies born preterm, before 37 weeks, health professionals usually use corrected age, meaning age minus the weeks born early, until about 24 months. Ask your care provider which age they use for growth charts.
Home measurements, especially length lying down, are less precise than clinic readings. Two people are needed to stretch a baby out flat, so small differences between visits are usually measurement error, not real growth changes.
Results are estimates for general information, not medical advice. Track measurements regularly at routine well-baby visits, and speak with your doctor, nurse or midwife about any percentile outside the usual range or a changing trend.
Frequently asked questions
What is a normal percentile for a baby?
Any percentile between the 3rd and 97th is within the range used on Canadian growth charts. What matters most is that your baby grows steadily along a similar curve over time, not the exact number.
Is the 50th percentile the best?
No. The 50th percentile is simply the middle of the reference group. A baby on the 15th or 90th percentile can be perfectly healthy if growth stays steady along the same curve.
Which growth charts are used in Canada?
Canada uses the WHO Growth Charts for Canada, based on the WHO Child Growth Standards. This calculator uses the same WHO data for boys and girls from birth to 24 months.
Should I use corrected age for a premature baby?
Usually yes. For babies born before 37 weeks, health professionals plot growth using corrected age until about 24 months. Ask your care provider which age they use at check-ups.
What does a z-score mean?
A z-score shows how many standard deviations a measurement is from the median. A z-score of 0 is the 50th percentile, and scores of about −1.88 and +1.88 match the 3rd and 97th percentiles.
Should I worry if my baby is in a low percentile?
Not necessarily. Many small babies are healthy and simply follow a lower curve. A drop across percentile lines, poor feeding or a reading below the 3rd percentile is worth discussing with your doctor.