How to Use the Investment Calculator
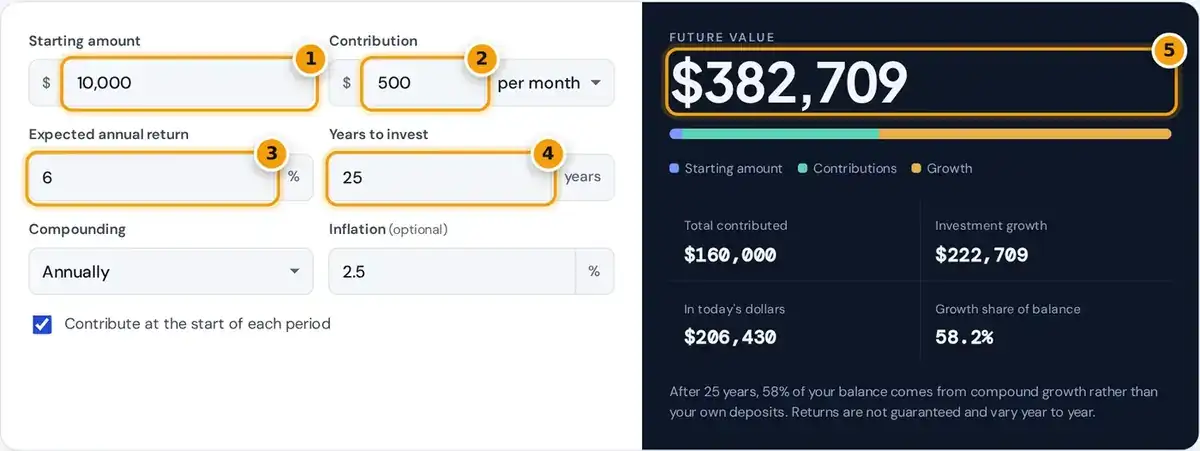
- Enter the amount you are starting with.
- Add your regular contribution and pick monthly, bi-weekly or yearly.
- Type the expected annual return, for example 6% for a balanced portfolio.
- Set how many years you plan to invest.
- Read the future value, then compare contributions, growth and the value in today's dollars.
Enter your starting amount, which is the initial investment you already hold today. Then add the additional contribution you plan to make regularly and pick a contribution frequency: per month, bi-weekly or once per year.
Next, type an expected annual return and a time horizon between 1 and 80 full years. Choose a compounding option and, if you like, an inflation rate. The tool recalculates the moment any input changes.
The results show the future value, the total contributed, the investment growth and the share of your balance that came from growth. Open the year-by-year growth table to watch the balance build steadily over time.
How Compound Growth Is Calculated
Compound interest means each period's return is added to the balance, so later returns are earned on earlier returns as well as on your deposits. This snowball effect is exactly why time matters so much.
P is the starting amount, r the annual return, m the compounding frequency per year, t the years, C each contribution, i the effective rate per contribution period and n the number of contributions made.
The final (1 + i) applies when you contribute at the beginning of each period, known as an annuity due. Untick that box and the calculator switches to end-of-period deposits, which grow slightly less over time.
Worked Example: $10,000 Plus $500 a Month
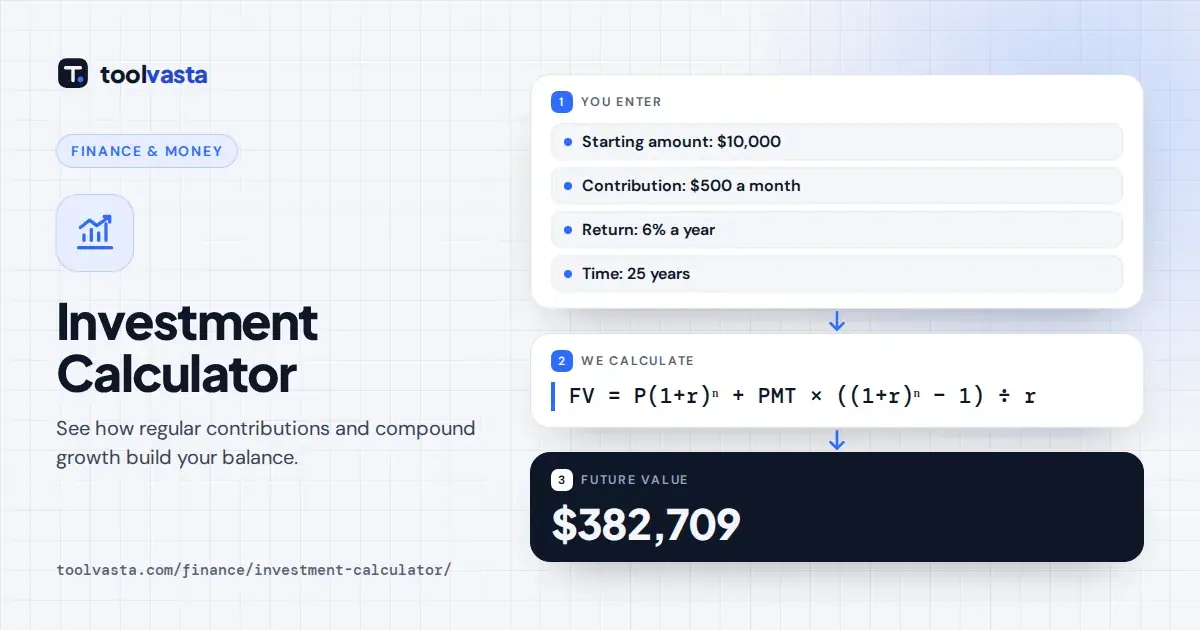
Take the default inputs: a $10,000 starting amount, $500 added at the start of each month, a 6% expected annual return, annual compounding and 25 years. The end balance comes to about $382,709 in total.
| Compounding | Balance after 25 years |
|---|---|
| Annually | $382,709 |
| Quarterly | $390,951 |
| Monthly | $392,879 |
| Daily | $393,825 |
You contribute $160,000 of that balance yourself. The remaining $222,709 is investment growth, so more than half of the final amount is money you never deposited. That share keeps rising the longer you stay invested.
Switching from annual compounding to monthly compounding lifts the result to about $392,879. Quarterly compounding and daily compounding land between and slightly above those figures, as the table shows, so frequency matters less than time.
What Rate of Return Should You Use?
Pick a rate of return that fits your asset mix and risk tolerance. A balanced portfolio is often modelled between 4% and 6% a year, while an all-equity portfolio is modelled higher with more volatility.
Always subtract costs first. A fund's management fee, reported in Canada as the MER, comes out of your return every year. Dropping the example from 6% to 4% cuts the 25-year balance to about $281,915.
A conservative estimate helps protect your plan when markets later disappoint. Add an inflation rate as well: at 2.5%, the $382,709 example is worth roughly $206,000 in today's dollars, which reflects its real purchasing power.
Types of Investments You Can Model
The calculator works for any asset expected to grow at a steady average rate. Enter the return you expect after fees, then compare several scenarios side by side to see how sensitive the outcome is.
- Stocks, ETFs, mutual funds and an index fund: growth plus dividends, with larger yearly swings.
- Bonds and GICs: steadier interest, lower long-run returns, and bond prices fall when interest rates rise.
- Real estate and commodities: returns depend on prices, costs and timing.
Diversification across these assets spreads risk because different holdings rarely all fall at the same time. A single blended return for the whole portfolio is usually more realistic than the best figure for one asset.
Remember that real returns arrive unevenly. A portfolio can lose value in one year and recover the next, while the calculator smooths everything into one constant rate, so treat the output as a planning average.
Investment Growth Versus ROI
Return on investment, or ROI, compares your net return with what you invested. The usual formula is simply final value minus amount invested, divided by amount invested, then multiplied by 100 to express a percentage.
In the default example, ROI is ($382,709 minus $160,000) divided by $160,000, about 139%. That figure ignores timing, because much of the money was deposited late, so the annual return is the better comparison measure.
Regular monthly deposits are a form of dollar-cost averaging, buying at many prices instead of one. Set an investment goal first, then adjust the contribution until the future value reaches the exact target you need.
Using It for a TFSA, RRSP or Taxable Account
Growth inside a Tax-Free Savings Account is tax-sheltered, and qualifying withdrawals are tax free. That makes the calculator's result close to what a TFSA can reach, within the available contribution room you have each year.
An RRSP also shelters growth, but withdrawals are taxed as income, which suits retirement savings when your tax rate is expected to drop. In a taxable account, interest, dividends and capital gains are taxed yearly.
For taxable money, enter a slightly lower return to allow for yearly tax drag. You can then compare the result with the Ontario Securities Commission compound interest calculator as a useful cross-check on your assumptions.
Frequently asked questions
How much will $500 a month be worth in 20 years?
At a 6% annual return compounded monthly, with each deposit made at the start of the month, $500 a month grows to about $232,176 after 20 years. You contribute $120,000 and the rest is compound growth.
What is the difference between compounding monthly and annually?
Monthly compounding adds returns to the balance 12 times a year, so they start earning sooner. At the same stated rate it gives a slightly higher result, for example $392,879 instead of $382,709 in the default scenario.
Does this investment calculator include taxes and fees?
No. Enter a return that is already net of fund fees such as the MER. Taxes depend on the account: growth in a TFSA or RRSP is sheltered, while a taxable account is taxed on income and gains each year.
What rate of return should I use?
Use a conservative figure that matches your asset mix after fees. Many planners model a balanced portfolio at 4% to 6% a year. Test a lower and a higher rate to see the range of outcomes.
How often should I contribute to my investments?
Contribute on a schedule you can keep, such as every payday. Monthly or bi-weekly deposits put money to work sooner than one yearly deposit and smooth out the prices you pay over time.
Why should I add an inflation rate?
Inflation reduces what money can buy. Adding an inflation rate converts the future value into today's dollars, which is the more useful number when planning a goal such as retirement income or a home purchase.