How to Use the ROAS Calculator
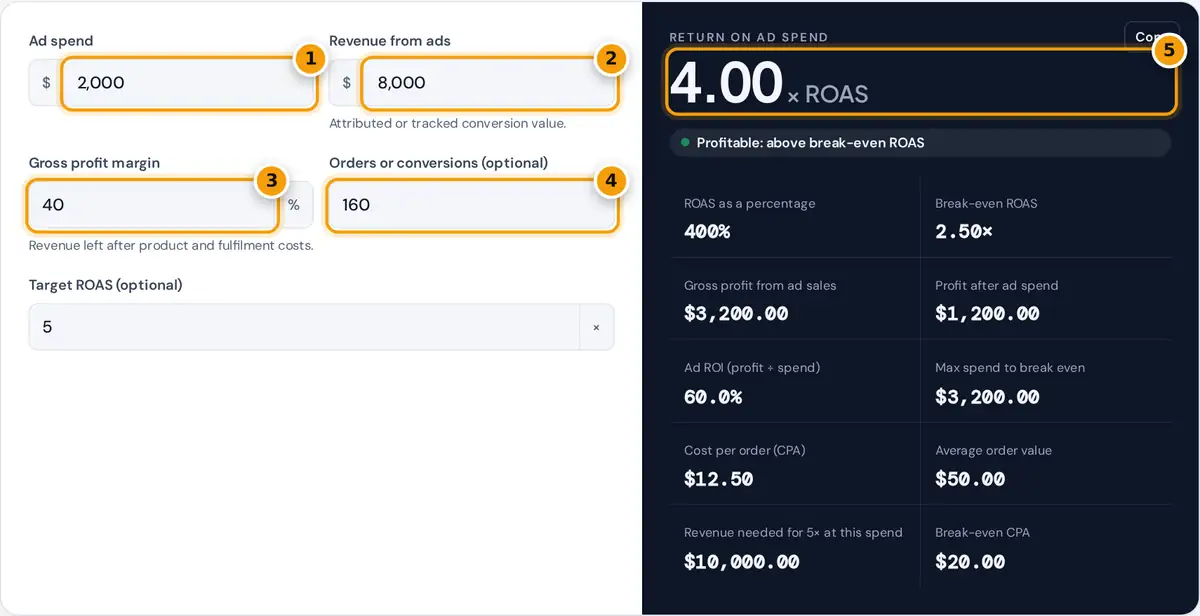
- Enter your ad spend for the campaign or period.
- Enter the revenue the ads produced.
- Enter your gross profit margin to get break-even ROAS and profit.
- Add orders and a target ROAS for CPA, AOV and revenue needed.
- Read ROAS, whether it beats break-even, and the profit after ad spend.
Enter your ad spend for a campaign or a period and the revenue those ads produced, usually the conversion value reported by your ad platform or analytics. The calculator shows return on ad spend as a ratio, such as 4.00×, and as a percentage. Then add your gross profit margin: the share of revenue left after the cost of the product, shipping and payment fees.
With the margin in place you get the break-even ROAS, the gross profit the ads generated, the profit or loss after paying for the ads, and the most you could have spent without losing money. Add the number of orders to see cost per order (CPA) and average order value (AOV), and a target ROAS to see the revenue that the same spend must produce.
ROAS Formula
break-even ROAS = 1 ÷ gross margin
profit after ads = revenue × margin − ad spend
ad ROI = profit after ads ÷ ad spend
CPA = ad spend ÷ orders AOV = revenue ÷ orders
ROAS measures revenue, not profit. A business keeping 40 cents of each sales dollar needs $2.50 of revenue for every $1 of ads just to cover the ad cost, so its break-even ROAS is 1 ÷ 0.40 = 2.50×. A store with a 25% margin needs 4.00×. That is why one company's good ROAS can be another company's loss.
Platforms label the same idea differently. Google Ads shows conversion value divided by cost, which is ROAS as a ratio, while other tools report it as a percentage. A ROAS of 3.5 and a ROAS of 350% describe the same result.
For subscription businesses, use the expected value of a customer over a reasonable period instead of the first payment. Otherwise campaigns that bring loyal customers look worse than they really are.
Worked Example
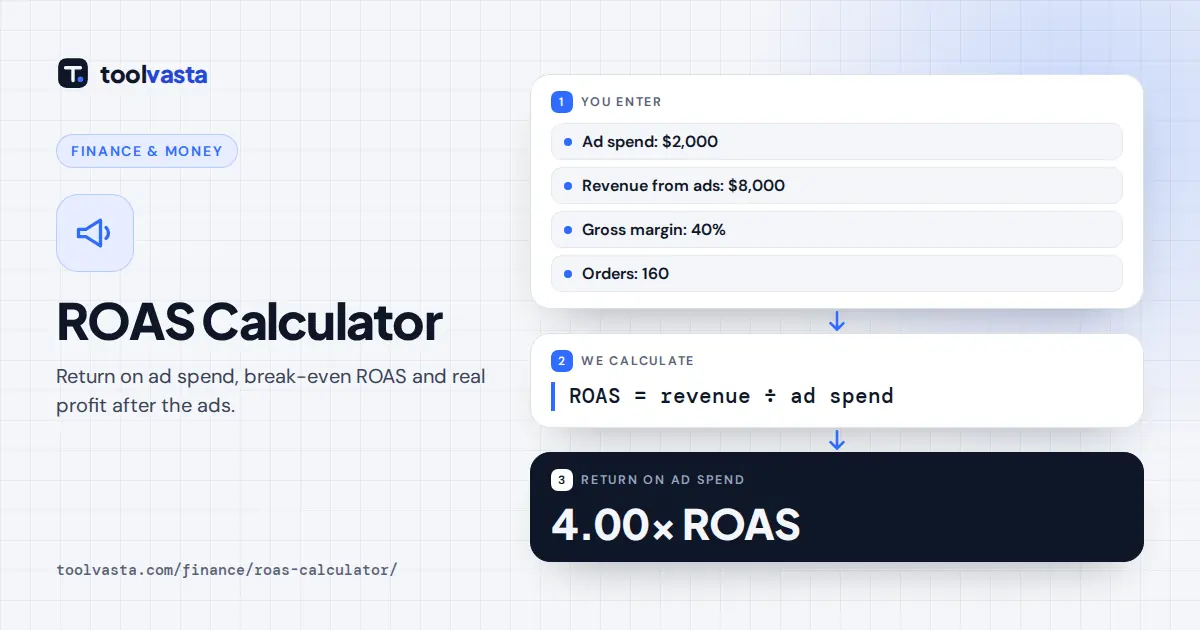
An online store spends $2,000 on ads and tracks $8,000 of sales from 160 orders. ROAS is 8,000 ÷ 2,000 = 4.00×, or 400%. With a 40% gross margin, the sales produced $3,200 of gross profit. After paying $2,000 for ads the campaign earned $1,200, an ad ROI of 60.0%, and the break-even ROAS is 2.50×.
Each order cost $12.50 in ads, against an average order value of $50.00 and a break-even CPA of $20.00. To hit a 5× target at the same spend, the ads would need to bring in $10,000. If revenue fell to $4,000 the ROAS would drop to 2.00×, below break-even, and the campaign would lose $400.
Break-Even ROAS by Margin
| Gross margin | Break-even ROAS | As a percentage |
|---|---|---|
| 20% | 5.00× | 500% |
| 25% | 4.00× | 400% |
| 33% | 3.03× | 303% |
| 40% | 2.50× | 250% |
| 50% | 2.00× | 200% |
| 60% | 1.67× | 167% |
| 75% | 1.33× | 133% |
Use break-even ROAS as the floor for bidding. Many advertisers set a target ROAS somewhat above it so that each campaign covers overheads and leaves a profit.
Tips for Reading ROAS
- Check the attribution window and model. Platform-reported revenue often includes sales that would have happened anyway, so compare with your own store data.
- Include agency fees, creative costs and software in ad spend if you want a full picture of marketing cost.
- Consider repeat purchases. A first order below break-even can still pay off if customers come back, which is why some brands judge ads on customer lifetime value.
- Compare campaigns over the same time period. Seasonal sales, promotions and stock levels all move ROAS.
- Use the max spend figure to set daily budgets that stay profitable at your current conversion rate.
Assumptions and Limits
The calculator trusts the revenue you enter and applies one average margin to all of it. Product mix, discounts and returns change the real margin. It does not include fixed overheads, so a campaign above break-even ROAS adds gross profit but may still not cover rent and salaries on its own. Results work in any currency.
Frequently asked questions
How do you calculate ROAS?
Divide the revenue generated by ads by the amount spent on those ads. Spending $2,000 to generate $8,000 in sales gives a ROAS of 4, often written as 4x or 400%.
What is a good ROAS?
A good ROAS is one above your break-even point, which depends on margin. With a 40% gross margin you break even at 2.5x, so anything well above that is profitable on gross profit.
How do I calculate break-even ROAS?
Divide 1 by your gross profit margin as a decimal. A 25% margin gives a break-even ROAS of 4x, and a 50% margin gives 2x. Below that, ads cost more than they earn.
What is the difference between ROAS and ROI?
ROAS compares revenue with ad spend. ROI compares profit with cost. A campaign can have a ROAS of 2x and still lose money if the margin is below 50%.
Should ROAS include shipping and taxes?
Leave sales taxes out of revenue, because they are not your income. Shipping charged to customers can be included if its cost is part of your margin, but stay consistent between campaigns.
Why is my ROAS high but profit low?
High ROAS on low-margin products, heavy discounts, returns or ignored costs such as fees and creative production can leave little profit. Enter your true margin to see profit after ad spend.