How to Use the Dividend Growth Calculator
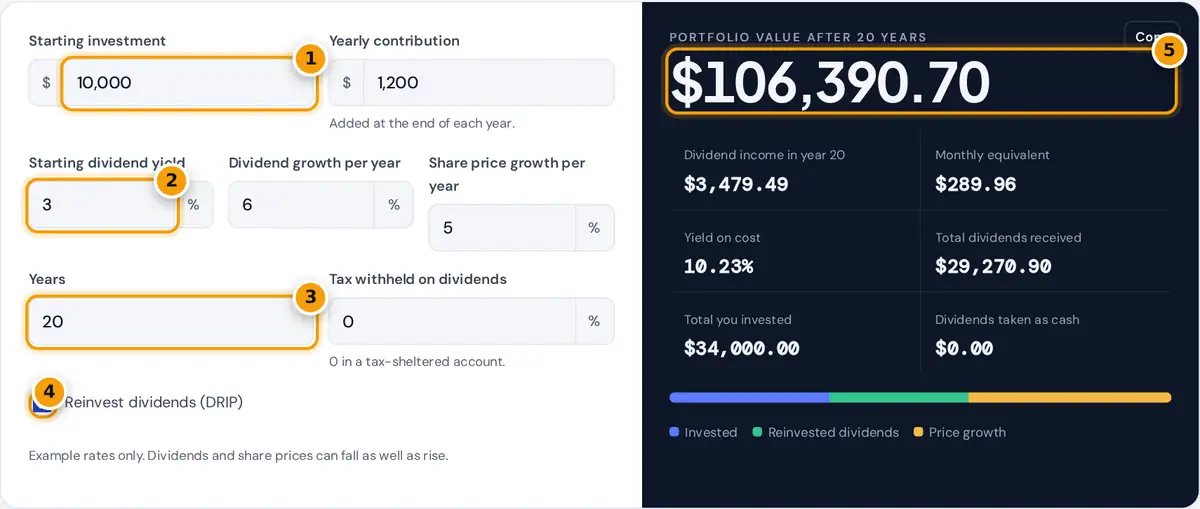
- Enter your starting investment and yearly contribution.
- Enter the starting dividend yield, dividend growth and price growth.
- Set the number of years and any tax withheld on dividends.
- Tick reinvest dividends for a DRIP, or untick to take cash.
- Read the portfolio value, final-year income and yield on cost.
Enter how much you are investing today and how much you plan to add each year. Then enter the starting dividend yield of your stock, fund or portfolio, the rate at which you expect the dividend per share to grow, and the rate at which you expect the share price to grow. Set the number of years and any tax withheld on dividends; use 0 for a tax-sheltered account such as a TFSA, RRSP or IRA.
Tick Reinvest dividends to model a DRIP, where every payout buys more shares. Untick it to take dividends as cash. The result shows the portfolio value, the dividend income in the final year, your yield on cost, total dividends received and a year-by-year table you can download as a CSV file. All rates are your own assumptions.
How the Projection Works
dividend per share in year t = starting yield × starting price × (1 + dividend growth)t−1
dividends in year t = shares held × dividend per share
with DRIP: new shares = dividends after tax ÷ share price
yield on cost = yearly dividends ÷ total amount invested
Dividends are paid once a year at year end, then reinvested, and your yearly contribution buys shares at the year-end price. Yield on cost compares the income with the money you put in, which is why it climbs over time when dividends grow, even if the current yield on the market price stays about the same.
Try a few scenarios side by side: a high-yield portfolio with slow dividend growth, and a lower-yield portfolio with faster growth. Over long periods the faster grower often catches up in income, which the yield on cost line makes easy to see.
Worked Example
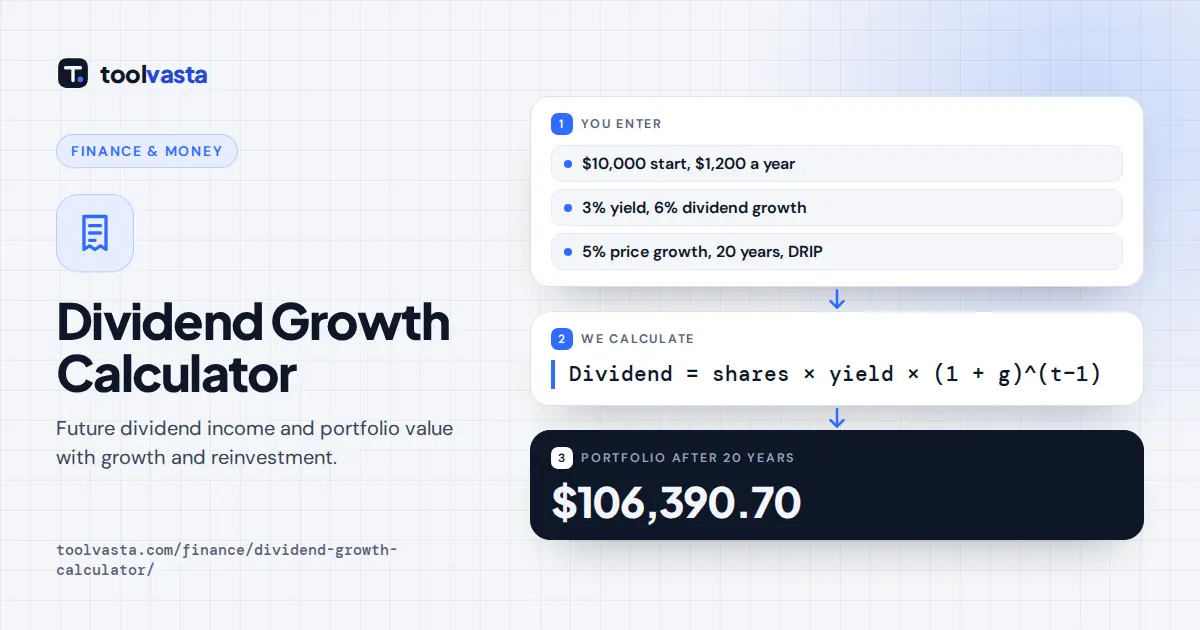
You invest $10,000 and add $1,200 a year for 20 years, a total of $34,000. The starting yield is 3%, dividends grow 6% a year and share prices grow 5% a year, with all dividends reinvested. In year one you receive $300 of dividends. After 20 years the portfolio is worth about $106,390.70 and pays $3,479.49 a year, or $289.96 a month.
That income is a yield on cost of 10.23% on the $34,000 you invested, and you would have received $29,270.90 of dividends along the way. Taking dividends as cash instead leaves a portfolio worth $66,212.12 plus $21,740.89 of dividends paid out, and final-year income of $2,224.03.
How Dividend Growth Changes Income
| Dividend growth | Income per $100 after 10 years | After 20 years | Years to double |
|---|---|---|---|
| 3% a year | $134.39 | $180.61 | 23.4 |
| 5% a year | $162.89 | $265.33 | 14.2 |
| 7% a year | $196.72 | $386.97 | 10.2 |
| 10% a year | $259.37 | $672.75 | 7.3 |
The table shows how $100 of yearly dividend income grows from the same shares, without reinvesting or adding money. Reinvesting dividends and contributing more push the income higher still.
Tips for Dividend Investors
- A very high starting yield can signal a dividend at risk of being cut. Look at the payout ratio and the company's history.
- Dividend growth rates from the past are not guaranteed. Try a lower growth rate to see a more cautious outcome.
- Diversify across sectors. A portfolio that relies on one industry can see many dividends cut at once.
- Taxes on dividends differ by country and account type. Foreign dividends may have tax withheld at source even in some registered accounts.
- Fees reduce returns. Lower the price growth rate by your fund's annual fee to include it.
Assumptions and Limits
The projection uses constant rates and a single annual payment, while real dividends are usually paid quarterly or monthly and markets move every day. It ignores inflation, brokerage fees and dividend cuts. This is an educational estimate, not investment advice, and amounts work in any currency. For decisions, speak with a licensed financial advisor.
Frequently asked questions
How do I calculate dividend growth?
Multiply this year's dividend by one plus the growth rate for each year. A $300 yearly dividend growing at 6% becomes about $318 next year and about $537 after ten years.
What is yield on cost?
Yield on cost is your current yearly dividend income divided by the amount you invested. It rises over time when dividends grow, even though the yield on today's market price may not change.
What does DRIP mean?
DRIP stands for dividend reinvestment plan. Instead of paying cash, each dividend buys more shares, which then pay their own dividends, so income and the number of shares compound over time.
How much do I need to invest to earn $1,000 a month in dividends?
At a 4% yield you would need about $300,000, because $12,000 a year divided by 0.04 is $300,000. A higher yield needs less money but often carries more risk.
Are dividends guaranteed to grow?
No. Companies can freeze or cut dividends, especially in recessions. Use cautious growth rates and test lower scenarios to see how sensitive your income is.
Should I include taxes in a dividend projection?
Include them if the account is taxable. Enter the share of dividends lost to tax so less is reinvested. In a tax-sheltered account you can leave the tax rate at zero.