How to Use the CAGR Calculator
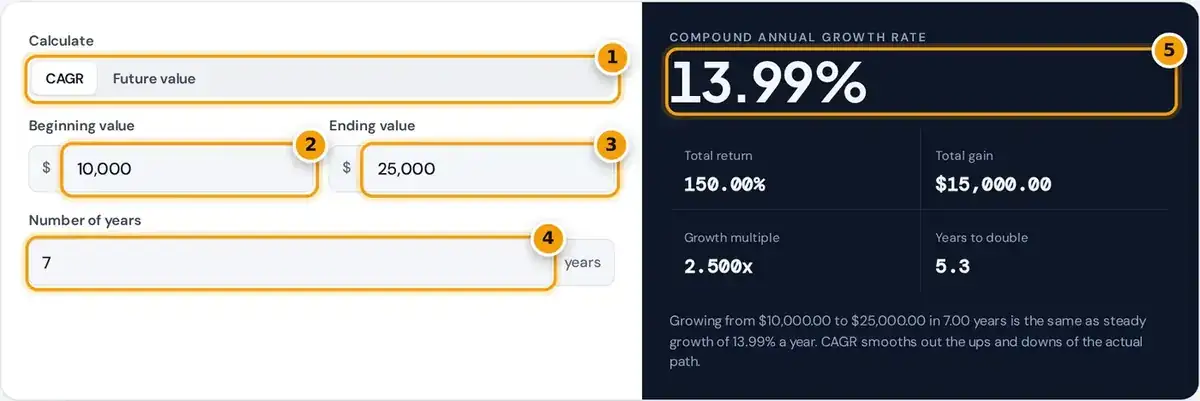
- Choose CAGR, or future value from a known CAGR.
- Enter the beginning value.
- Enter the ending value.
- Enter the number of years, decimals allowed.
- Read the CAGR, with total return, growth multiple and years to double.
In CAGR mode, enter the beginning value, the ending value and the number of years between them. Years can include decimals, so three years and six months is simply entered in the box as 3.5.
The result shows the compound annual growth rate, the total return, the dollar gain, the growth multiple and the years to double at that rate. A growth path table lists the value year by year.
Switch to Future value mode to reverse the calculation. Enter a beginning value, a growth rate and a number of years, and the calculator projects the ending value along with all the same supporting figures.
What Is CAGR
The compound annual growth rate is the constant yearly rate that would take a beginning value to an ending value if growth were perfectly smooth. It turns an uneven path into one simple, comparable number.
CAGR is a geometric average, so it assumes gains are reinvested and compound each year. That makes it the same idea as an annualized return, which is how funds and companies usually report multi-year performance.
Because it depends only on the first and last values, CAGR works for anything that grows or shrinks: an investment, a salary, sales revenue, a population or the price of a home over many years.
The CAGR Formula
Divide the ending value by the beginning value, raise the result to the power of one divided by the number of years, then subtract 1. Multiply by 100 to show the answer as a percentage.
Future value = beginning value × (1 + CAGR)years
The second line reverses the formula. It starts from a present value and grows it at a fixed rate, which is what the Future value mode of the calculator does for any number of years.
The calculator also shows years to double, which is the natural log of 2 divided by the natural log of one plus the rate. That is the exact version of the familiar shortcut investors use.
Worked Examples
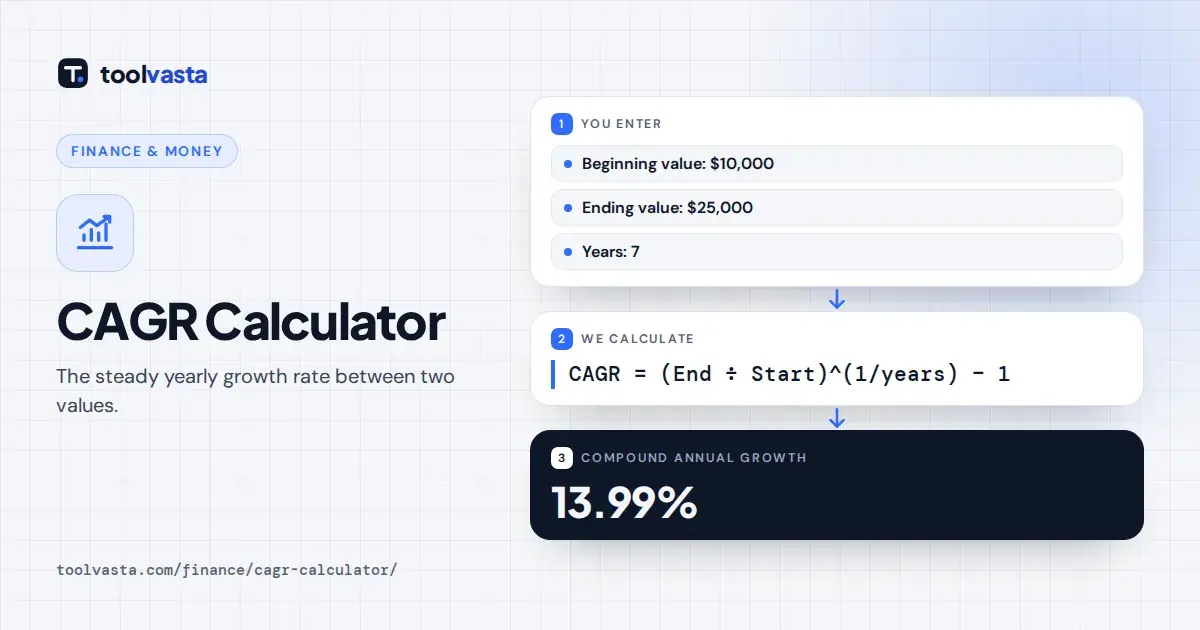
In a worked example, an investment grows from $10,000 to $25,000 over 7 years. The ratio is 2.5, and 2.5 to the power of one seventh is 1.13985, so the CAGR works out to 13.99%.
The total return is exactly 150%, and at 13.99% a year the value doubles about every 5.3 years. In reverse, $10,000 growing at 8% a year for 10 years becomes $21,589.25 at the very end.
CAGR works the same way for a business. Revenue that rises from $2 million to $3.2 million over four years has a CAGR of about 12.47%, even if the individual yearly results were very uneven.
CAGR Versus Average Annual Return
Suppose an investment rises 50% one year and falls 50% the next. The arithmetic average return is 0%, but $100 becomes $150 and then $75, so you have actually lost a quarter of your money.
The CAGR is 0.75 to the power of one half, minus 1, or negative 13.40%. It reflects reality, which is why reports following the GIPS standards present annualized returns for periods longer than a year.
| Growth multiple | Over 5 years | Over 10 years |
|---|---|---|
| 1.5x | 8.45% | 4.14% |
| 2x | 14.87% | 7.18% |
| 3x | 24.57% | 11.61% |
The table above shows the CAGR needed for each growth multiple. The larger the volatility of yearly returns, the further the simple average drifts above the CAGR, so always use CAGR when comparing investment results.
CAGR Versus Absolute Return and IRR
Absolute return is the total change from start to finish, 150% in the first example. It ignores time, so a 150% gain over 7 or 20 years looks identical, while their two CAGRs differ enormously.
CAGR uses only the start and end values. When money is added or withdrawn along the way, IRR, or XIRR in spreadsheets, accounts for each of those cash flows and gives a fairer money-weighted return.
The rule of 72 is a quick check on CAGR. Divide 72 by the rate to estimate doubling time: at 13.99%, it gives about 5.1 years, close to the exact 5.3 years the calculator shows.
Where CAGR Is Used
Investors use CAGR to compare mutual funds, stocks or a whole portfolio over different periods. A fund that returned 60% over five years can then be set against a benchmark index on equal yearly terms.
Businesses use it for revenue, customer or profit growth over several years, and analysts use it to project the future. It is also handy in planning, such as the rate needed to double your savings.
In real estate, CAGR gives the yearly appreciation of a home between purchase and sale. Doubling any value in 10 years requires a CAGR of 7.18%, and tripling it over the same decade needs 11.61%.
Calculating CAGR in Excel or Google Sheets
To check a result yourself in Excel or Google Sheets, type =(end/start)^(1/years)-1, replacing the three words with your own cell references. Format the cell as a percentage to read it as a yearly growth rate.
Both programs also include a built-in function, RRI, which takes the number of periods, the starting value and the ending value in that order. It returns exactly the same CAGR result as the formula above.
For uneven deposits, use XIRR with a column of dated cash flows instead. Negative values are money going in, positive values are money coming out, and the function returns an annual money-weighted rate of return.
Limits of CAGR
CAGR ignores volatility and risk. Two separate investments with the same CAGR can have very different ups and downs along the way, and the smooth growth path in the table never actually happened in reality.
It also ignores the timing of deposits and withdrawals. If you added money during the period, CAGR on the start and end balances overstates your return, so an IRR calculation is usually far more accurate.
Finally, CAGR describes past performance and does not predict or guarantee future returns, and it is not adjusted for inflation. For projections with regular contributions, try the Investor.gov compound interest calculator alongside this CAGR tool.
Frequently asked questions
How do you calculate CAGR?
Divide the ending value by the beginning value, raise the result to the power of 1 divided by the number of years, then subtract 1. Growth from $10,000 to $25,000 in 7 years is 13.99%.
What is a good CAGR?
It depends on what you measure. Compare CAGR only between similar assets over the same period, against a relevant benchmark, and remember that a higher CAGR usually came with higher risk.
Can CAGR be negative?
Yes. If the ending value is lower than the beginning value, CAGR is negative. A fall from $100 to $75 over 2 years is a CAGR of negative 13.40% a year.
What CAGR doubles money in 10 years?
A CAGR of 7.18% doubles a value in 10 years, because 2 to the power of one tenth is about 1.0718. Over 5 years, doubling needs a CAGR of 14.87%.
What is the difference between CAGR and IRR?
CAGR uses only the start and end values. IRR also accounts for deposits and withdrawals along the way, so it is the better measure when cash flows happen during the period.
Is CAGR the same as average annual return?
No. The average annual return is an arithmetic mean of yearly returns, while CAGR is a geometric average. With volatile returns the simple average is higher and can badly overstate real growth.