How to Use the Inflation Calculator
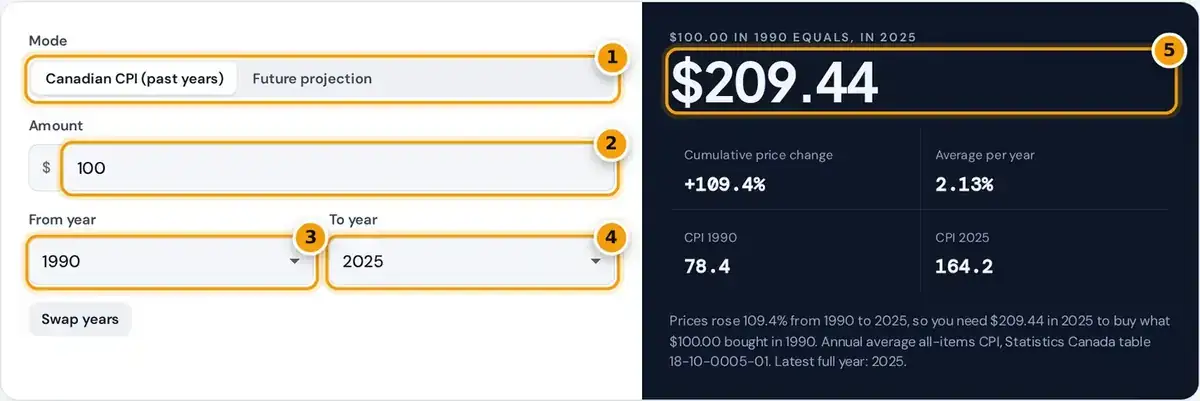
- Choose past years using Canadian CPI, or a future projection.
- Enter the dollar amount.
- Pick the starting year, back to 1914.
- Pick the year to compare with.
- Read the equivalent value, with cumulative and average yearly inflation.
In Canadian CPI mode, enter an amount and choose a from year and a to year between 1914 and 2025. The result shows what that amount equals in the other year, in equal buying power.
You can go forward, such as $100 from 1990 in today's money, or backward, and the swap button flips the two years. The Show CPI table button opens every annual index value the calculator uses.
Switch to Future projection to enter today's cost, an expected inflation rate and a number of years. The tool then shows the future cost, the buying power lost and how long prices take to double.
The Inflation Formula
Average annual inflation = (CPIB / CPIA)1 / years − 1
Future cost = cost today × (1 + inflation)years
Past values use the Consumer Price Index, or CPI, in the two years you choose. Multiply the amount by the CPI ratio, the later index divided by the earlier one, to get the equivalent value.
The cumulative change is that ratio minus one. The average annual inflation rate is the ratio raised to one divided by the number of years, minus one, which treats price growth as steady yearly compounding.
Future values use compound growth at a constant rate: the cost today times one plus the inflation rate, raised to the number of years. Each year's increase builds on the higher price from last year.
Worked Example
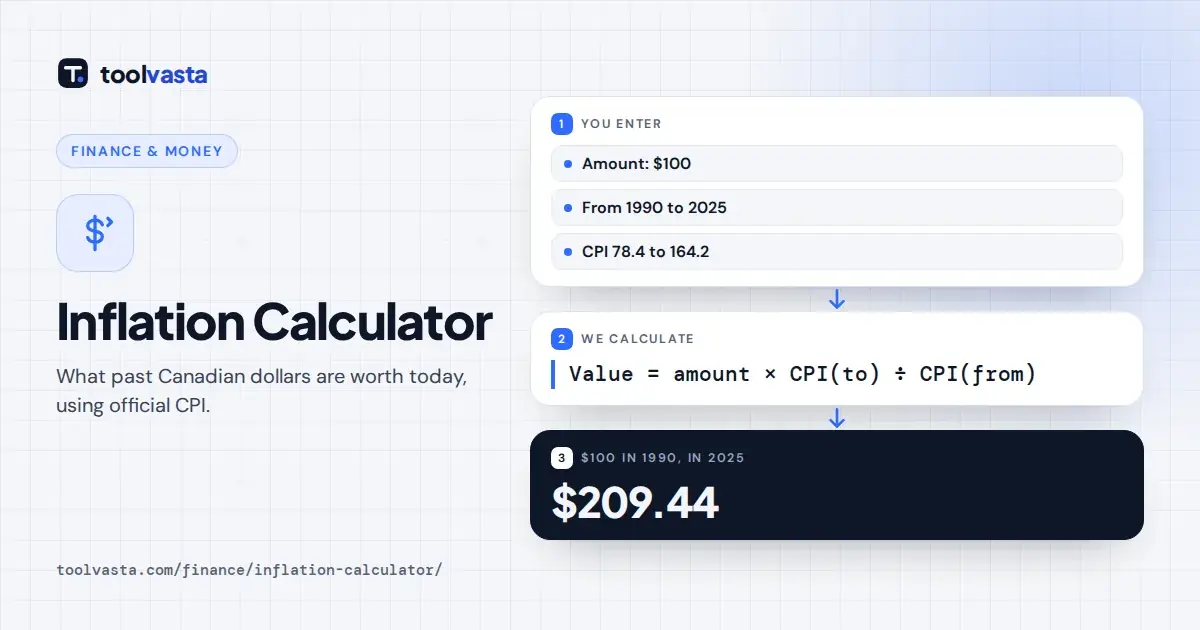
The annual average CPI was 78.4 in 1990 and 164.2 in 2025. So $100 in 1990 equals $100 times 164.2 divided by 78.4, which is $209.44 in today's dollars, the default result shown on screen.
Prices therefore rose a cumulative 109.4% over those 35 years. Spread evenly, that is an average of 2.13% a year, which sits close to the middle of the range the Bank of Canada targets today.
Going the other way, $50 in 2020 equals about $51.68 in 2021, because the index rose from 137.0 to 141.6. Choose any pair of years and the note under the result explains the change clearly.
Future Projection
Take the projection defaults: $1,000, 2.5% expected inflation and 10 years. The future cost is $1,000 times 1.025 raised to the tenth power, or $1,280.08. The panel also shows the years for prices to double.
The same inflation means $1,000 kept as cash would buy only $781.20 of today's goods, so the value lost is about $21.88 per $100. Holding savings in cash quietly shrinks your real wealth over time.
At 2.5% a year, prices double in about 28.1 years. The rule of 72 gives a quick mental check: divide 72 by the rate, and you get 28.8 years, which is close enough for planning.
Where the CPI Data Comes From
| Year | CPI | Annual inflation |
|---|---|---|
| 2019 | 136.0 | +1.9% |
| 2020 | 137.0 | +0.7% |
| 2021 | 141.6 | +3.4% |
| 2022 | 151.2 | +6.8% |
| 2023 | 157.1 | +3.9% |
| 2024 | 160.9 | +2.4% |
| 2025 | 164.2 | +2.1% |
The historical mode uses the annual average all-items Consumer Price Index for Canada from Statistics Canada table 18-10-0005-01, with 2002 = 100 as the base year. Coverage runs from 1914 to 2025, the latest full year.
Values match the annual series published by BC Stats, the provincial statistics agency. In its 2025 annual review, Statistics Canada reported an index level of 164.2 and annual inflation of 2.1%, after 2.4% in 2024.
The base year does not change any result, because only the ratio between two years matters. The sharpest recent jump came in 2022, when the index rose 6.8%, the largest annual increase in four decades.
How This Compares With the Bank of Canada Inflation Calculator
The Bank of Canada inflation calculator uses monthly CPI values, so it can compare specific months. This tool uses annual averages, which smooth out seasonal swings and suit comparisons of whole years such as salaries.
For the same pair of years the two tools give close but not identical results. Both rely on Statistics Canada data, so differences come from monthly versus annual figures rather than from the method itself.
The Bank aims to keep inflation at a 2% target, the midpoint of a 1% to 3% range, as its inflation-control target page explains. It also watches core inflation measures that strip out volatile prices.
Common Uses
The most common use is checking whether a salary has kept up with the cost of living since you were hired. If your pay grew more slowly than the CPI, your real purchasing power fell.
The tool also converts historical prices, such as a house bought in the 1980s or a grandparent's wage, into today's Canadian dollar, which makes old figures far easier to compare with current prices and wages.
Renters and landlords use it to judge a rent increase against inflation, and savers use the projection mode to set a retirement target in future dollars that will still cover the same lifestyle later on.
Limits of CPI Comparisons
CPI measures the average price change of a fixed basket of goods and services bought by Canadian households. It is an average, so it rarely matches the spending pattern of any one real household exactly.
Your personal inflation rate depends on what you buy. Shelter carries the largest weight in the basket, and food and energy often move faster or slower than the overall national index from year to year.
This calculator uses national figures, so it does not show the differences by province. Future projections also assume a constant rate, while real inflation changes every year, so treat long forecasts as rough estimates only.
Frequently asked questions
How much is $100 in 1990 worth today in Canada?
Using the annual average CPI, $100 in 1990 has the same buying power as about $209.44 in 2025. Prices roughly doubled over those 35 years, an average rise of 2.13% a year.
What was inflation in Canada in 2025?
Statistics Canada reported that the Consumer Price Index rose 2.1% on an annual average basis in 2025, following 2.4% in 2024. The 2025 index level was 164.2, with 2002 set to 100.
Is this the same as the Bank of Canada inflation calculator?
Both use Statistics Canada CPI data. The Bank of Canada tool uses monthly values, while this calculator uses annual averages, so results can differ slightly for the same pair of years.
What inflation rate should I use for future planning?
Many planners use 2% to 3% a year. The Bank of Canada aims to keep inflation at 2%, the midpoint of its 1% to 3% target range, but actual inflation varies from year to year.
How do you calculate inflation between two years?
Divide the CPI of the later year by the CPI of the earlier year and multiply your amount by the result. For 1990 to 2025, $100 times 164.2 divided by 78.4 gives $209.44.
Why is the CPI base year 2002?
Statistics Canada expresses the index relative to 2002, when it is set to 100. Only the ratio between two years matters for the calculation, so the base year does not change the result.