How to Use the Opportunity Cost Calculator
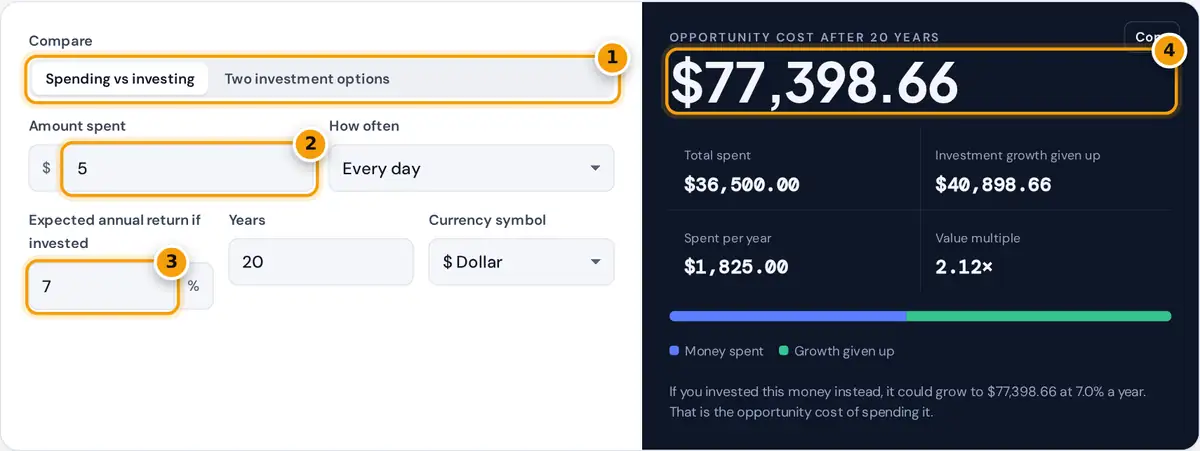
- Choose spending vs investing, or compare two investment options.
- Enter the amount and how often you spend it.
- Enter the return you could earn and the number of years.
- Read the opportunity cost, total spent and growth given up.
Choose Spending vs investing to see what a habit or purchase really costs. Enter the amount, how often you spend it and the yearly return you could earn by investing the money instead, then the number of years. A $5 coffee every day, a $15 monthly subscription or a one-time $2,000 upgrade all have a cost beyond their price: the growth the money could have earned.
Choose Two investment options to compare where to put a sum of money, such as a savings account at 3% versus a diversified fund you expect to return 7%. The calculator shows the value of each option and the difference, which is the opportunity cost of choosing the lower-return option. Both modes work in any currency.
Opportunity Cost Formulas
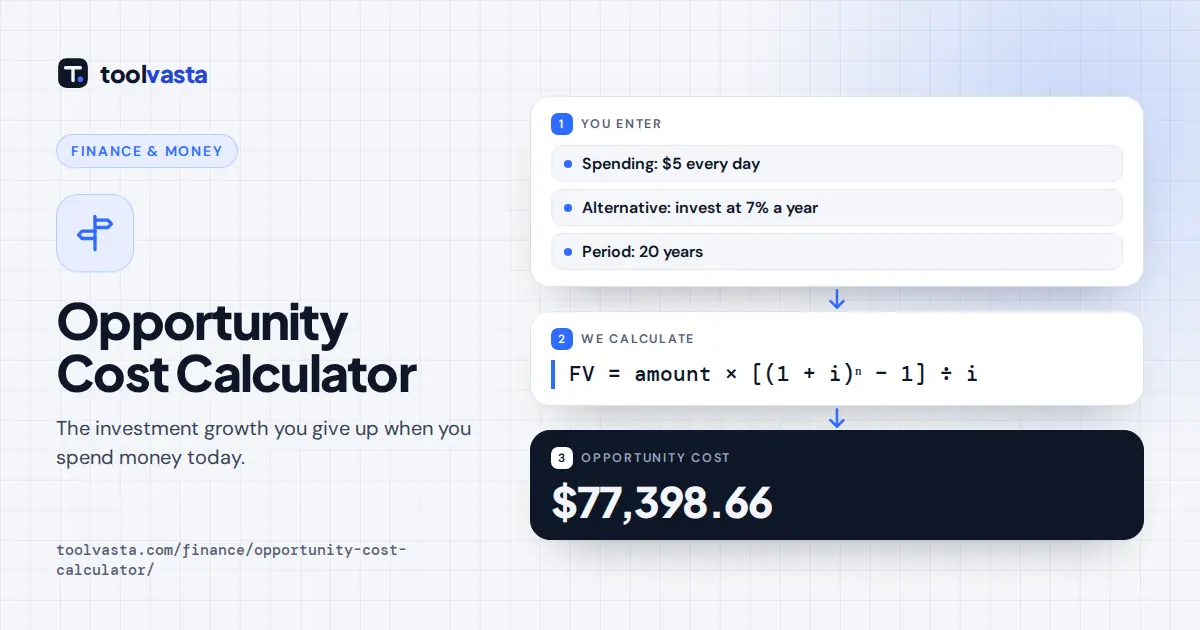
recurring: FV = amount × [(1 + i)n − 1] ÷ i, i = (1 + r)1/f − 1, n = f × years
growth given up = FV − total spent
opportunity cost of a choice = value of best alternative − value of chosen option
For recurring spending, each payment is treated as invested at the end of its period. The annual return is converted to an equivalent rate per day, week or month so that the yearly growth matches the rate you enter. Opportunity cost is the value of the best alternative you give up, which is why it compares values rather than just prices.
Opportunity cost is not only about money. Time, risk and flexibility matter too, but putting a number on the financial side makes trade-offs easier to judge.
Worked Example
Spending $5 every day for 20 years adds up to $36,500. Invested at 7% a year instead, the same money could grow to $77,398.66, so the habit gives up $40,898.66 of investment growth. A one-time $2,000 purchase has an opportunity cost of $7,739.37 after 20 years at 7%.
Putting $10,000 in a savings account at 3% for 10 years gives $13,439.16. The same money in an option returning 7% would reach $19,671.51, so the opportunity cost of the safer choice is $6,232.35, the price paid for lower risk.
| $5 a day invested at | 10 years | 20 years | 30 years |
|---|---|---|---|
| 5% a year | $23,522.28 | $61,837.60 | $124,249.22 |
| 7% a year | $26,085.17 | $77,398.66 | $178,340.05 |
| 9% a year | $28,953.48 | $97,496.89 | $259,764.08 |
Over 30 years the $54,750 spent at $5 a day could become between about $124,000 and $260,000, depending on the return.
The same idea applies to bigger decisions. Paying cash for a car instead of investing, keeping a large emergency fund in a low-interest account, or choosing a cheaper rent so you can invest the difference all have an opportunity cost you can estimate here. Enter the amount involved and the return of the alternative to see the trade-off in money.
Tips for Weighing Trade-Offs
- Opportunity cost does not mean you should never spend. It helps you decide which spending is worth it to you.
- Compare options with similar risk. A higher expected return usually comes with more ups and downs.
- Include taxes and fees in the returns you enter so the comparison reflects what you would really keep.
- Small regular amounts matter more than one-off purchases over long periods, because every payment has years to compound.
- Paying off high-interest debt is often the best alternative. Its opportunity cost equals the interest rate saved.
Assumptions and Limits
The calculator uses a constant return, while real investment returns vary and can be negative. It does not include inflation, so future values are in future money; reduce the return by expected inflation to see values in today's terms. Non-financial benefits of spending are up to you to weigh. This is an educational estimate, not investment advice. See the compound interest calculator for more growth scenarios.
Frequently asked questions
What is opportunity cost?
Opportunity cost is the value of the best alternative you give up when you make a choice. In money terms, it is often what the money could have earned if you had invested it instead of spending it.
How do you calculate opportunity cost?
Subtract the value of the option you choose from the value of the best option you give up. For spending, calculate what the money would grow to if invested and compare it with what you spent.
What is the opportunity cost of a daily coffee?
At $5 a day invested at 7% a year, the cost after 20 years is about $77,399 in investment value, compared with $36,500 actually spent. The difference is the growth given up.
Is opportunity cost the same as the price?
No. The price is what you pay today. Opportunity cost adds what that money could have become, so it is usually larger, especially for regular spending over many years.
Should I include risk when comparing options?
Yes. A higher return usually means more risk. The calculator shows the gap on return alone, so weigh it against the safety, access to cash and peace of mind each option offers.
Does the calculator account for inflation?
Not directly. Results are in future money. To see values in today's money, enter a return reduced by your expected inflation rate, for example 4% instead of 7% with 3% inflation.