How to Use the Outlier Calculator
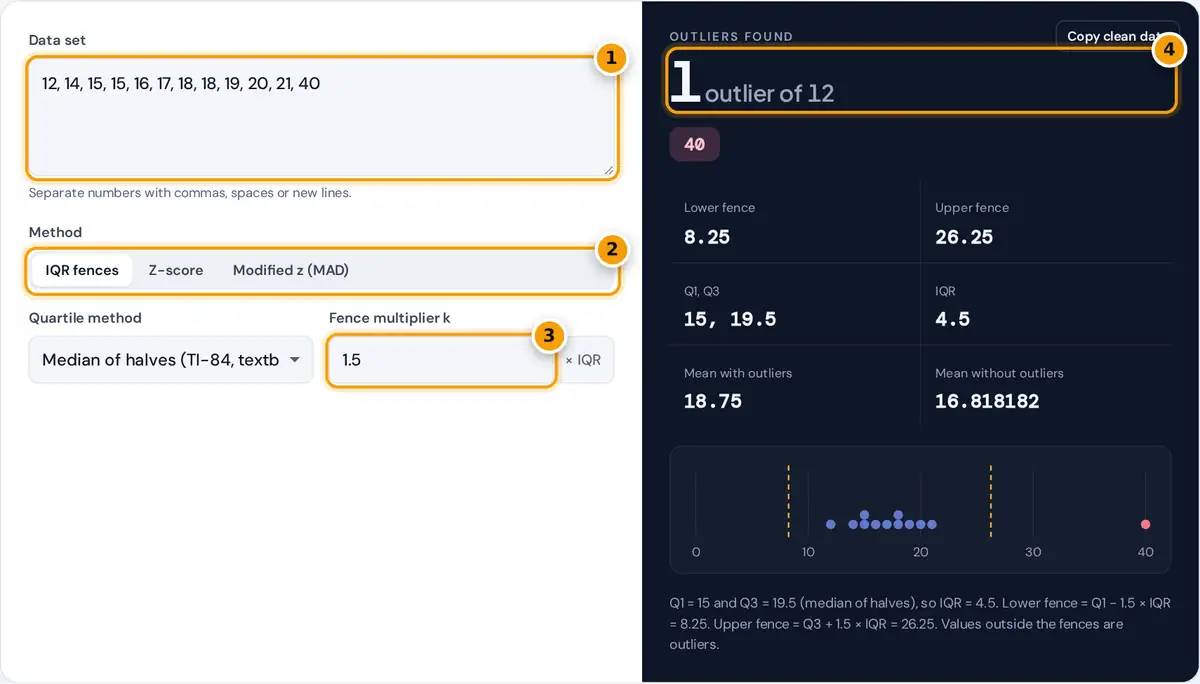
- Paste your data, separated by commas, spaces or new lines.
- Choose IQR fences, z-score or the modified z-score based on the median.
- Set the fence multiplier, 1.5 for outliers or 3 for extreme outliers.
- See how many outliers were found, the fences used and the mean without them.
Paste your numbers into the data box, separated by commas, spaces or new lines. Then pick a method. IQR fences is the familiar 1.5 × IQR rule taught in statistics courses and used by box plots. Z-score flags values far from the mean in standard deviation units. Modified z (MAD) is a robust version based on the median.
The result shows how many outliers were found, lists each one, and gives the fences or limits that were used. The dot plot marks outliers in red with the fences dashed, and the mean is shown with and without the flagged values. Copy clean data copies the remaining numbers, ready to paste elsewhere.
The 1.5 × IQR Rule
Lower fence = Q1 − k × IQR Upper fence = Q3 + k × IQR
k = 1.5 for outliers, k = 3 for extreme outliers
This rule, introduced by John Tukey, uses quartiles, so the outliers themselves barely move the fences. It works for skewed data and small samples, which is why it is the default in most courses. The quartile method can be changed to match the TI-84, Excel or R.
Z-Score and Modified Z-Score Rules
MAD = median of |x − median|
M = 0.6745 × (x − median) ÷ MAD flag when |M| > 3.5
The z-score rule assumes roughly normal data, where about 99.7 percent of values fall within 3 standard deviations of the mean. Its weakness is that an outlier inflates the standard deviation that is supposed to expose it. With n values, no z-score computed with the sample standard deviation can exceed (n − 1) ÷ √n, so a sample of 10 can never have |z| above 2.85.
The modified z-score, recommended by Iglewicz and Hoaglin, replaces the mean with the median and the standard deviation with the median absolute deviation. Neither is pulled by extreme values, so it finds outliers that the ordinary z-score misses. The NIST/SEMATECH e-Handbook of Statistical Methods describes both approaches.
Worked Example
For the data 12, 14, 15, 15, 16, 17, 18, 18, 19, 20, 21 and 40, the methods give different verdicts on the value 40.
| Method | Working | Is 40 an outlier? |
|---|---|---|
| 1.5 × IQR | Q1 = 15, Q3 = 19.5, IQR = 4.5, fences 8.25 and 26.25 | Yes |
| Z-score, cutoff 3 | Mean 18.75, s = 7.1748, z = 2.9618 | No |
| Modified z, cutoff 3.5 | Median 17.5, MAD = 2.5, M = 6.0705 | Yes |
The z-score misses 40 because the value itself pushes the standard deviation up from about 2.7 to 7.2. Removing 40 drops the mean from 18.75 to 16.82, which shows how much a single outlier can distort an average.
Which Outlier Test Should You Use?
Use the 1.5 × IQR rule for most classroom work, for skewed data, and whenever you plan to draw a box plot, because it is the rule a box plot uses. It does not depend on the data being normal, and the outliers themselves have little effect on the fences.
Use the z-score rule only when the data are roughly bell shaped and the sample is reasonably large, say 30 values or more. It is common in quality control and test scoring, where the mean and standard deviation are already the standard summaries. Use the modified z-score when you want a test that is both robust and scaled like a z-score, which makes it a good default for laboratory and sensor data.
What to Do With Outliers
- Check first. Many outliers are typing errors, unit mix-ups or faulty readings, and these should be corrected or removed.
- Keep genuine values. A real but unusual observation is information. Report it, and consider the median and IQR, which resist outliers, instead of the mean and standard deviation.
- Be consistent. Decide on the rule before looking at results, and state which rule and cutoff you used.
- Do not repeat the test after removing outliers. The fences shrink each time, and you can end up deleting good data.
Frequently asked questions
How do you find outliers using the IQR?
Find Q1 and Q3, then IQR = Q3 − Q1. Any value below Q1 − 1.5 × IQR or above Q3 + 1.5 × IQR is an outlier. Use 3 × IQR instead to flag only extreme outliers.
What z-score counts as an outlier?
A common cutoff is |z| greater than 3, meaning more than three standard deviations from the mean. Some fields use 2.5 or 2. The rule assumes the data are roughly normal and works poorly for small samples.
Why does the z-score method miss an obvious outlier?
An extreme value inflates the standard deviation used to measure it, which shrinks its own z-score. In small samples the largest possible |z| is limited to (n − 1) ÷ √n. The IQR and modified z methods avoid this problem.
What is the modified z-score?
It is 0.6745 times the distance from the median, divided by the median absolute deviation. Values with an absolute modified z-score above 3.5 are flagged, a cutoff recommended by Iglewicz and Hoaglin.
Should I remove outliers from my data?
Only if you can show they are errors, such as typos or faulty readings. Genuine extreme values belong in the data. Report them, and consider robust summaries like the median and IQR.
Why do different calculators give different fences?
They use different quartile methods. The TI-84 takes medians of the halves, while Excel interpolates. Pick the matching quartile method in this calculator to reproduce the fences from your course or software.