How to Use the Standard Deviation Calculator
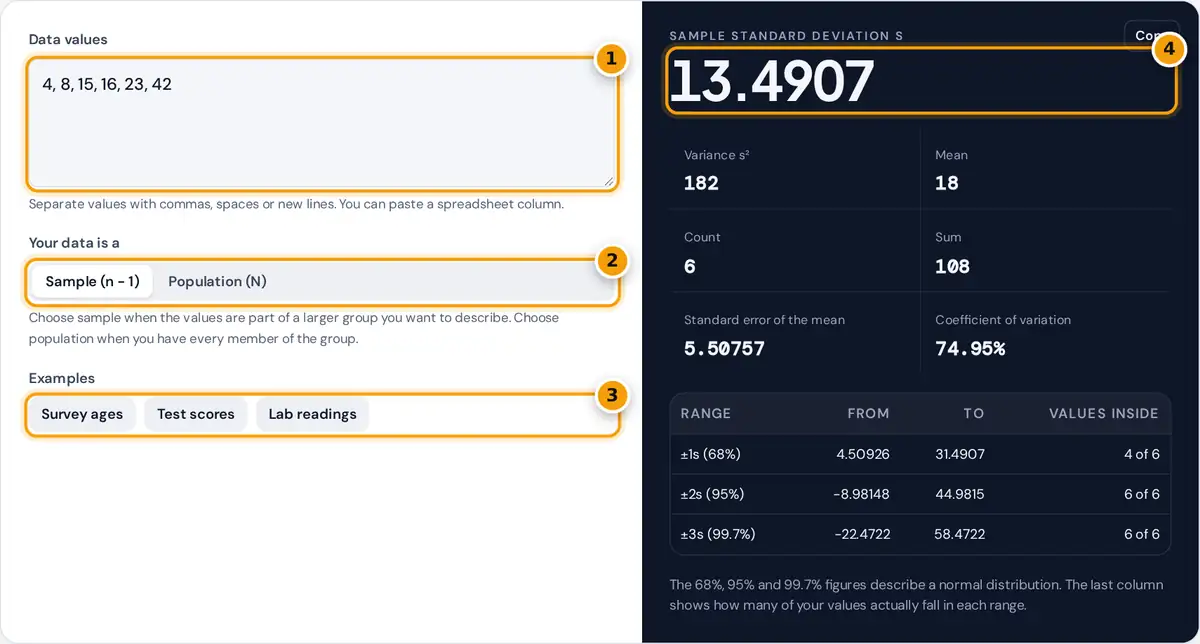
- Paste or type your data values.
- Choose sample (n − 1) or population (N).
- Or try an example data set.
- Read the standard deviation, variance, mean and the empirical rule ranges.
Type or paste your numbers into the box, separated by commas, spaces or new lines. Then choose whether the data is a sample or a whole population. The standard deviation appears instantly, together with the variance, mean, count, sum, standard error of the mean and coefficient of variation.
The table in the result panel shows the ranges one, two and three standard deviations either side of the mean and how many of your values fall in each. Below the tool, every step of the calculation is written out with a table of deviations and squares, so you can copy the working into an assignment or check your own arithmetic line by line.
Standard Deviation Formulas
Population: σ = √[ Σ(x − μ)² ÷ N ]
Standard error of the mean = s ÷ √n Coefficient of variation = s ÷ x̄ × 100%
Both formulas measure the typical distance of the values from their mean. The only difference is the divisor. A sample divides by n − 1, known as Bessel’s correction, because a sample mean sits closer to its own data than the true population mean does, and dividing by n would underestimate the spread.
Worked Example
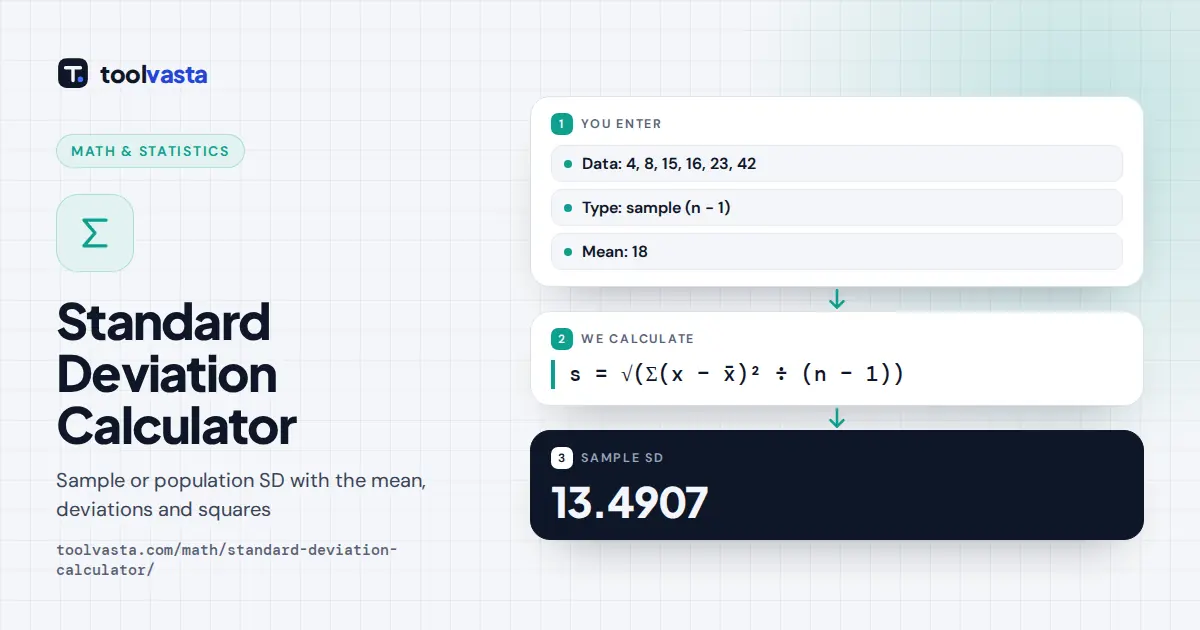
Find the sample standard deviation of 4, 8, 15, 16, 23 and 42.
- Mean: (4 + 8 + 15 + 16 + 23 + 42) ÷ 6 = 108 ÷ 6 = 18.
- Deviations: −14, −10, −3, −2, 5 and 24.
- Squares: 196, 100, 9, 4, 25 and 576, which add up to 910.
- Variance: 910 ÷ (6 − 1) = 182.
- Standard deviation: √182 = 13.4907.
If these six values were the entire population, you would divide by 6 instead: σ² = 151.667 and σ = 12.3153. The standard error of the mean is 13.4907 ÷ √6 = 5.5076.
Sample vs Population
| Sample | Population | |
|---|---|---|
| Symbol | s | σ (sigma) |
| Divide sum of squares by | n − 1 | N |
| Use when | Data is a subset, such as 50 surveyed customers | Data is every member, such as all students in one class |
| Spreadsheet function | STDEV.S | STDEV.P |
When in doubt, use the sample formula. Most real data sets are samples, and the difference between the two shrinks as n grows.
The 68-95-99.7 Rule
For data that follows a normal (bell-shaped) distribution, about 68% of values lie within one standard deviation of the mean, about 95% within two and about 99.7% within three. This empirical rule is a handy way to judge whether a value is unusual. The calculator counts how many of your own values fall in each range, which shows how closely your data matches a normal shape.
Reading the Result
A standard deviation only means something next to its mean. A spread of 13.5 around a mean of 18, as in the example, is large: the coefficient of variation is about 75%, so the values are very scattered. The same spread around a mean of 1,000 would be tiny. When you compare two groups measured in the same units, the one with the smaller standard deviation is the more consistent. When you report results, give the mean and the standard deviation together, for example 18 ± 13.5, and say whether it is a sample or a population value. For quality control, values more than two or three standard deviations from the mean are often flagged for a closer look.
Tips and Limits
- Standard deviation has the same units as the data, while variance has squared units.
- One extreme outlier can inflate the standard deviation a lot. Check the deviation table for unusually large squares.
- The coefficient of variation compares spread between data sets with different means, but it is only meaningful for data measured on a ratio scale with a true zero.
- The sample formula needs at least two values.
For definitions of these measures, see the NIST/SEMATECH e-Handbook of Statistical Methods.
Frequently asked questions
What does standard deviation tell you?
It tells you how spread out the values are around the mean. A small standard deviation means the values cluster close to the average, while a large one means they are widely scattered.
Should I use sample or population standard deviation?
Use the sample formula when your data is part of a larger group you want to describe, which is the usual case. Use the population formula only when you have measured every member of the group.
Why divide by n minus 1 for a sample?
A sample's values sit closer to their own mean than to the true population mean, so dividing by n underestimates spread. Dividing by n minus 1, Bessel's correction, removes that bias in the variance.
What is the difference between variance and standard deviation?
Variance is the average squared deviation from the mean, and standard deviation is its square root. Standard deviation is easier to interpret because it uses the same units as the data.
Can standard deviation be negative?
No. It is a square root of a sum of squares, so it is always zero or positive. It equals zero only when every value in the data set is exactly the same.
What is the standard error of the mean?
It is the standard deviation divided by the square root of n. It estimates how much the sample mean would vary between repeated samples, so it shrinks as the sample size grows.