How to Use the Quartile Calculator
- Paste or type your numbers, separated by commas, spaces or new lines.
- Pick the quartile method your textbook, Excel or TI-84 uses.
- Optionally enter any percentile and a fence multiplier for outliers.
- Read Q1, the median and Q3, then compare all four methods in the table below.
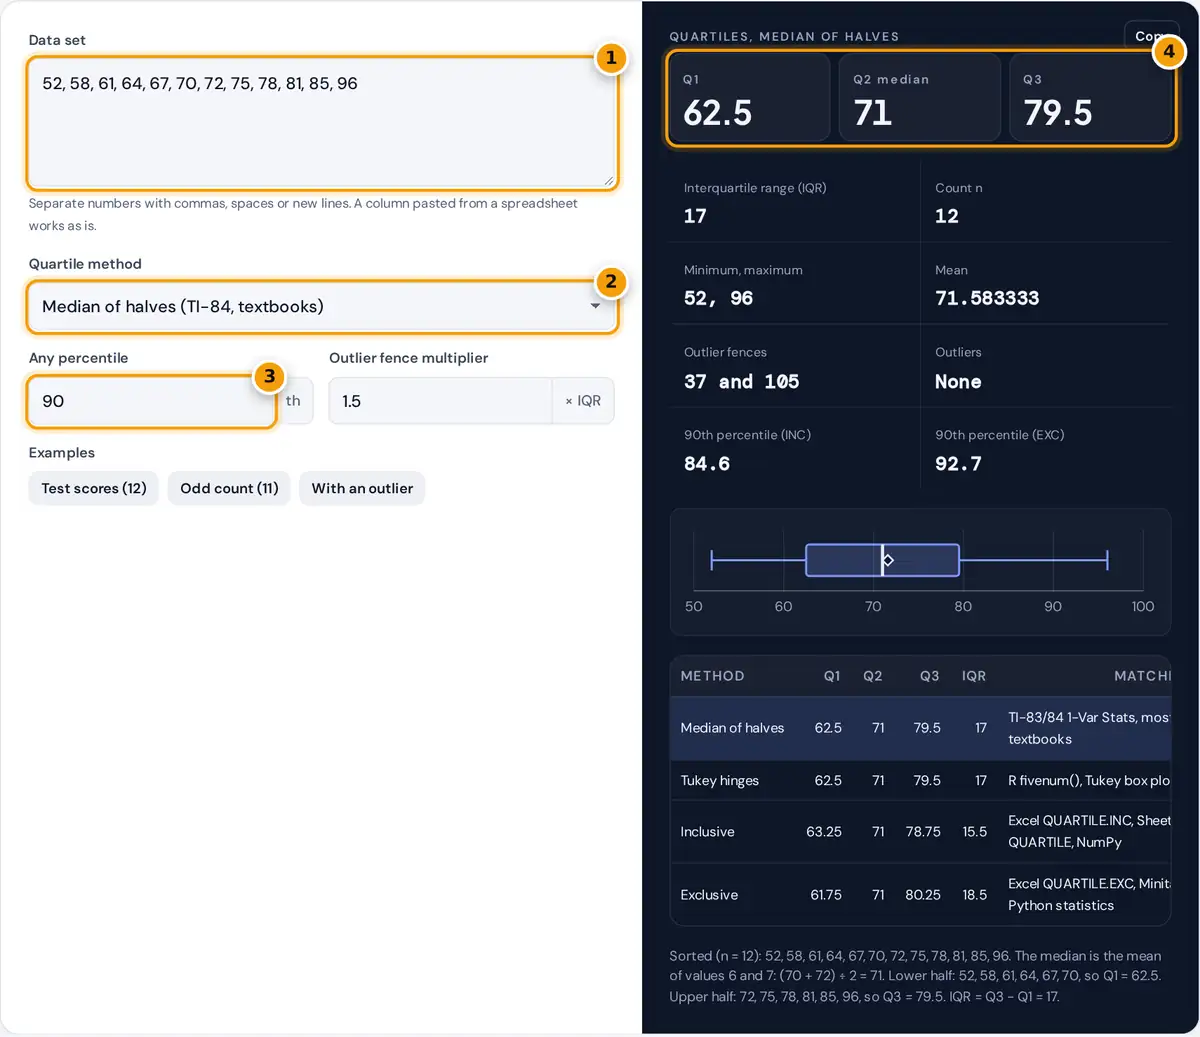
Paste or type your numbers into the data box. Commas, spaces, tabs and new lines all work, so a column copied from Excel or Google Sheets can go straight in. The calculator sorts the data and shows Q1, the median (Q2) and Q3 at once.
Choose the quartile method that matches your class or software. The table under the result compares all four methods for your data and names the function or calculator each one matches, so you can see why two sources disagree. The working note shows the sorted data and how each quartile was found.
The panel also gives the interquartile range, the minimum and maximum, the mean, the 1.5 × IQR outlier fences, any outliers, and any percentile you ask for. The small box plot draws the same five-number summary.
Quartile Methods Compared
There is no single official definition of a quartile for a sample, which is why calculators and textbooks sometimes give different answers for the same numbers. All four methods below agree on the median. They differ in how they split the data or interpolate between values.
| Method | How Q1 is found | Matches |
|---|---|---|
| Median of halves | Median of the lower half, median excluded when n is odd | TI-83/84 1-Var Stats, most school textbooks |
| Tukey hinges | Median of the lower half, median included when n is odd | R fivenum(), Tukey’s original box plot |
| Inclusive | Value at position 1 + (n − 1) × 0.25, interpolated | Excel QUARTILE.INC and QUARTILE, Google Sheets, NumPy default |
| Exclusive | Value at position (n + 1) × 0.25, interpolated | Excel QUARTILE.EXC, Minitab, Python statistics.quantiles |
For an even number of values the two “halves” methods give the same answer. The inclusive method always gives the narrowest IQR and the exclusive method the widest, with the halves methods in between.
Quartile Formulas
Inclusive position: L = 1 + (n − 1)p Exclusive position: L = (n + 1)p
Interpolate: Q = xₗ + f × (xₗ₊₁ − xₗ), where k is the whole part of L and f is the fraction
IQR = Q3 − Q1 Fences: Q1 − 1.5 × IQR and Q3 + 1.5 × IQR
Here p is 0.25 for Q1, 0.5 for the median and 0.75 for Q3, and xₗ is the k-th value in sorted order. The same position formulas give any percentile: use p = 0.9 for the 90th percentile.
Worked Example
Take the 12 test scores 52, 58, 61, 64, 67, 70, 72, 75, 78, 81, 85 and 96, which are already sorted. The median is the mean of the 6th and 7th values: (70 + 72) ÷ 2 = 71.
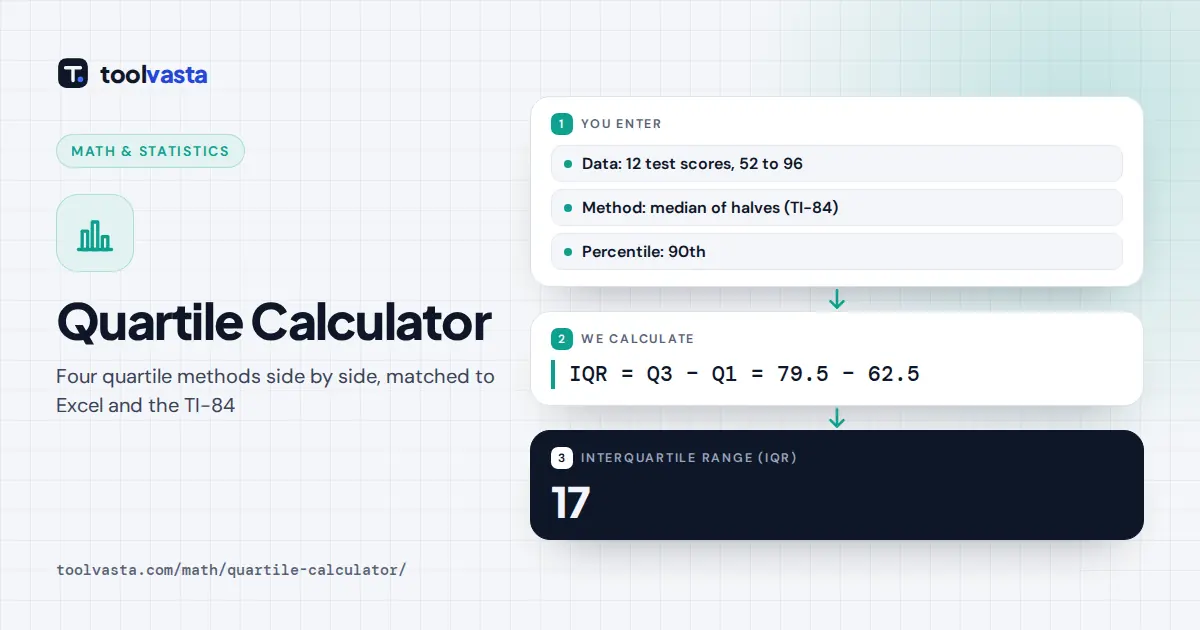
- Median of halves: the lower half is 52, 58, 61, 64, 67, 70, so Q1 = (61 + 64) ÷ 2 = 62.5. The upper half gives Q3 = (78 + 81) ÷ 2 = 79.5, and the IQR is 17.
- Inclusive: the Q1 position is 1 + 11 × 0.25 = 3.75, so Q1 = 61 + 0.75 × (64 − 61) = 63.25. Q3 sits at position 9.25, giving 78.75 and an IQR of 15.5.
- Exclusive: the Q1 position is 13 × 0.25 = 3.25, so Q1 = 61 + 0.25 × 3 = 61.75. Q3 sits at position 9.75, giving 80.25 and an IQR of 18.5.
With the halves method, the fences are 62.5 − 25.5 = 37 and 79.5 + 25.5 = 105, so none of the scores is an outlier.
Why the Interquartile Range Matters
The IQR is the spread of the middle half of the data. Unlike the range, it ignores the extreme values, so one unusual score cannot inflate it. That makes it the standard measure of spread to report alongside the median for skewed data such as incomes, house prices or reaction times.
The IQR also drives the most common outlier rule. Values below Q1 − 1.5 × IQR or above Q3 + 1.5 × IQR are flagged as possible outliers, and a multiplier of 3 flags extreme outliers. A box plot draws exactly these quantities.
Tips and Limits
- If your answer key disagrees with this page, switch the method. School courses and the TI-84 use median of halves, while spreadsheets use the inclusive formula by default.
- The exclusive method needs enough data for the requested percentile. Excel returns an error in the same cases this page flags.
- Quartiles describe the data you enter. With very small samples they are rough estimates of the population quartiles.
- For grouped data in a frequency table, list each value as many times as it occurs before calculating.
Frequently asked questions
How do you find Q1 and Q3?
Sort the data and find the median. With the textbook method, Q1 is the median of the lower half and Q3 is the median of the upper half, leaving out the middle value when the count is odd.
Why does Excel give a different quartile than my textbook?
Excel QUARTILE.INC interpolates at position 1 + (n − 1)p, while most textbooks and the TI-84 take medians of the two halves. Both are accepted definitions, so pick the method your course or report expects.
What is the difference between QUARTILE.INC and QUARTILE.EXC?
QUARTILE.INC uses position 1 + (n − 1)p and includes the minimum and maximum as the 0 and 100 percent points. QUARTILE.EXC uses position (n + 1)p, which spreads the quartiles further apart for small samples.
Which quartile method does the TI-84 use?
The TI-83 and TI-84 1-Var Stats command splits the sorted data into lower and upper halves, leaving out the median when the count is odd, and reports the median of each half as Q1 and Q3.
What is the interquartile range?
The interquartile range is Q3 minus Q1, the spread of the middle 50 percent of the data. It is resistant to outliers, which makes it a better measure of spread than the range for skewed data.
Is the second quartile the same as the median?
Yes. Q2 is the median, the middle value of the sorted data or the mean of the two middle values when the count is even. Every quartile method gives the same median.