How to Use the T Table Calculator
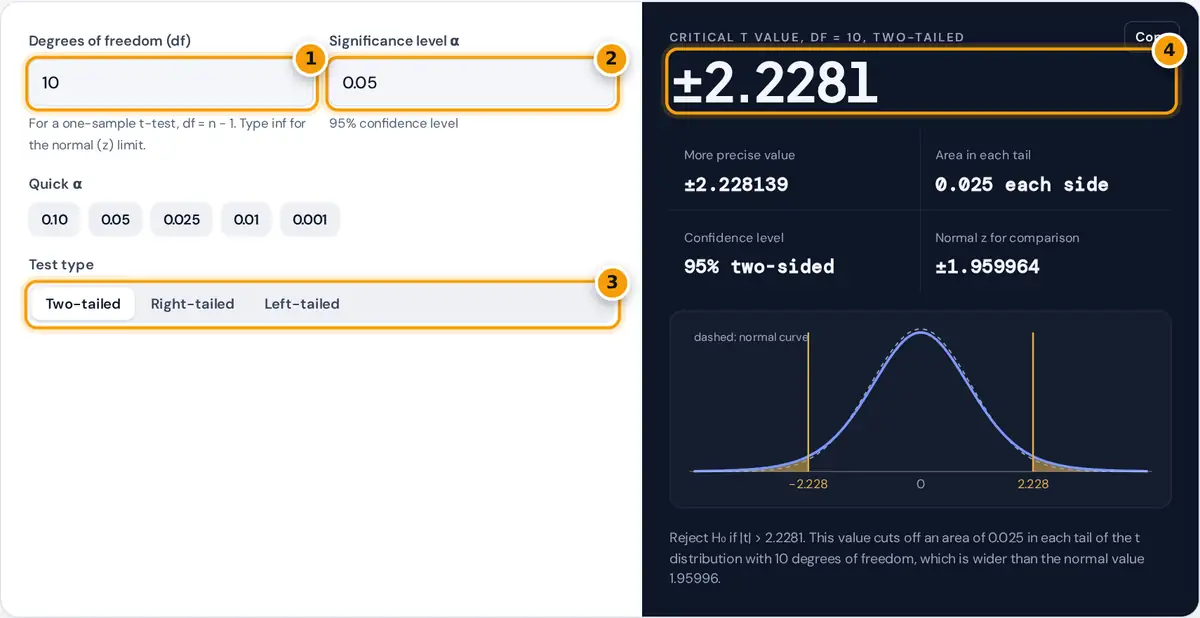
- Enter the degrees of freedom, for example n − 1, or inf for the z limit.
- Enter the significance level α or tap a quick value.
- Choose a two-tailed, right-tailed or left-tailed test.
- Read the critical t value, the tail area and the shaded curve. The full table is below.
Enter the degrees of freedom and the significance level α, then choose a two-tailed, right-tailed or left-tailed test. The critical t value appears immediately, with a more precise value, the area in each tail, the matching confidence level and the normal z value for comparison.
The curve shades the rejection region in amber, with the normal curve dashed so you can see how the t distribution has heavier tails. The full t table below the calculator highlights the row and column for your inputs whenever they appear in it, and the Print table button prints just the table on one page.
Degrees of freedom can be any positive number, including the fractional values produced by Welch’s t-test. Type inf to get the limiting normal value.
Finding the Degrees of Freedom
| Test | Degrees of freedom |
|---|---|
| One-sample t-test or confidence interval for a mean | n − 1 |
| Paired t-test | number of pairs − 1 |
| Two-sample t-test, pooled variances | n₁ + n₂ − 2 |
| Two-sample t-test, Welch | Welch–Satterthwaite formula, often fractional |
| Slope in simple linear regression | n − 2 |
What the Critical Value Means
Left-tailed: P(T < −t*) = α
Two-tailed: P(|T| > t*) = α, so each tail holds α ÷ 2
Confidence interval: x̄ ± t* × s ÷ √n with t* from the two-tailed α
The calculator solves these equations numerically with the regularized incomplete beta function, the exact relationship behind printed t tables. Values agree with published tables to every digit shown.
Worked Example
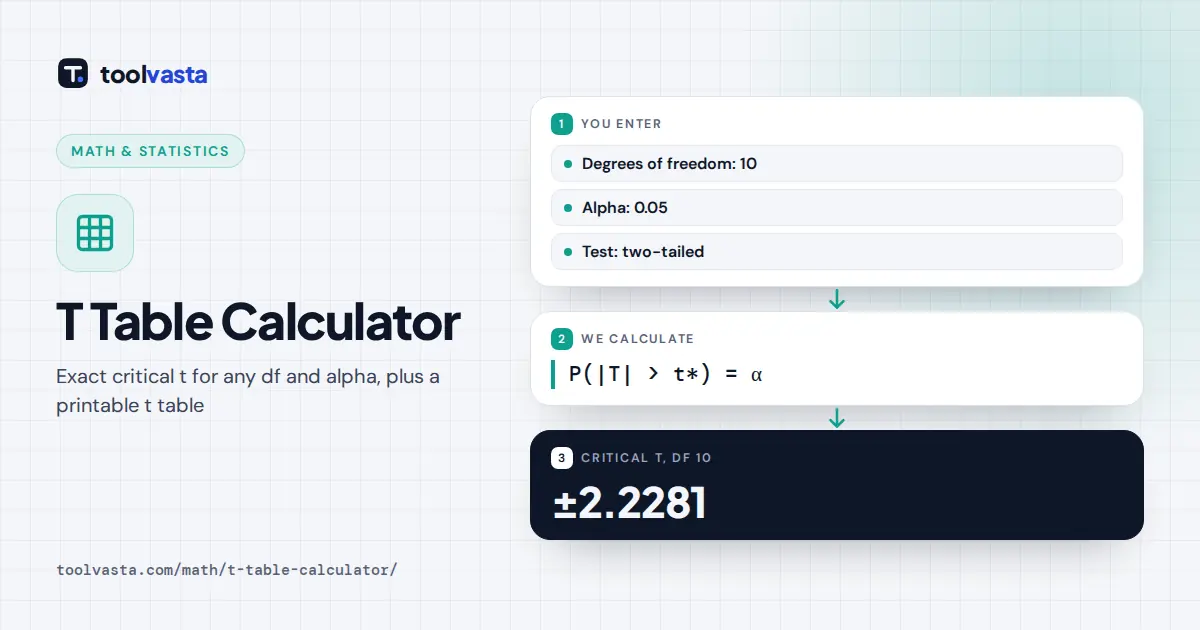
A sample of n = 11 measurements has df = 10. For a two-tailed test at α = 0.05, each tail holds 0.025, and the critical value is t* = 2.2281. You reject the null hypothesis if the test statistic is below −2.2281 or above 2.2281.
The same df and α for a one-tailed test put all 0.05 in one tail, giving t* = 1.8125. A 95 percent confidence interval for the mean uses the two-tailed value: x̄ ± 2.2281 × s ÷ √11.
| df | α = 0.10 (two-tailed) | α = 0.05 | α = 0.01 |
|---|---|---|---|
| 5 | 2.015 | 2.571 | 4.032 |
| 10 | 1.812 | 2.228 | 3.169 |
| 20 | 1.725 | 2.086 | 2.845 |
| 30 | 1.697 | 2.042 | 2.750 |
| ∞ (z) | 1.645 | 1.960 | 2.576 |
How to Read a Printed T Table
Find the row for your degrees of freedom, then move across to the column for your significance level. Most printed tables, including the one on this page, label the columns by the area in one tail. For a two-tailed test at α = 0.05, use the column headed 0.025 in one tail, which is also labeled 0.05 for two tails and 95 percent confidence.
If your df falls between two rows, the conservative choice is the smaller df, which gives a slightly larger critical value. The calculator above avoids that compromise by computing the exact value for any df. To use the table for a p-value, find where your t statistic falls between two columns in its row: the p-value lies between those column headings.
T Distribution vs Normal Distribution
The t distribution accounts for the extra uncertainty of estimating the standard deviation from a sample. With few degrees of freedom it has heavier tails, so the critical values are larger than the familiar z values. As df grows, t approaches the standard normal: at df = 30 the 95 percent two-tailed value is 2.042, and at df = 1,000 it is 1.962, almost the z value of 1.960.
Tips and Limits
- If your df is not in a printed table, do not round to the nearest row. Enter the exact df here instead.
- Use a two-tailed test unless you decided on a direction before seeing the data.
- Very large df are treated as the normal limit, and α must be greater than 0.
- For more background, see the NIST/SEMATECH table of the t distribution.
Frequently asked questions
How do I find the critical t value?
Work out the degrees of freedom, choose the significance level and decide whether the test is one-tailed or two-tailed. The critical value is the t that leaves α, or α ÷ 2 for two tails, in the tail of the t distribution.
What is the critical t value for 95% confidence?
It depends on the degrees of freedom. For df = 10 it is 2.228, for df = 20 it is 2.086, for df = 30 it is 2.042, and it approaches 1.960 as df grows large.
What is the difference between one-tailed and two-tailed t values?
A two-tailed test splits α between both tails, so each tail holds α ÷ 2 and the critical value is larger. A one-tailed test puts all of α in one tail, giving a smaller critical value.
How many degrees of freedom does my t-test have?
A one-sample or paired test uses n − 1. A pooled two-sample test uses n₁ + n₂ − 2. Welch's two-sample test uses the Welch–Satterthwaite formula, which often gives a fractional df.
Why are t values larger than z values?
The t distribution allows for the extra uncertainty of estimating the standard deviation from a small sample. Its heavier tails push the critical values outward. With large samples the difference becomes negligible.
Can I use a fractional degrees of freedom?
Yes. Enter any positive df, such as 17.4 from a Welch test. The calculator computes the exact critical value, which is more accurate than rounding to a row of a printed table.