How to Use the Correlation Coefficient Calculator
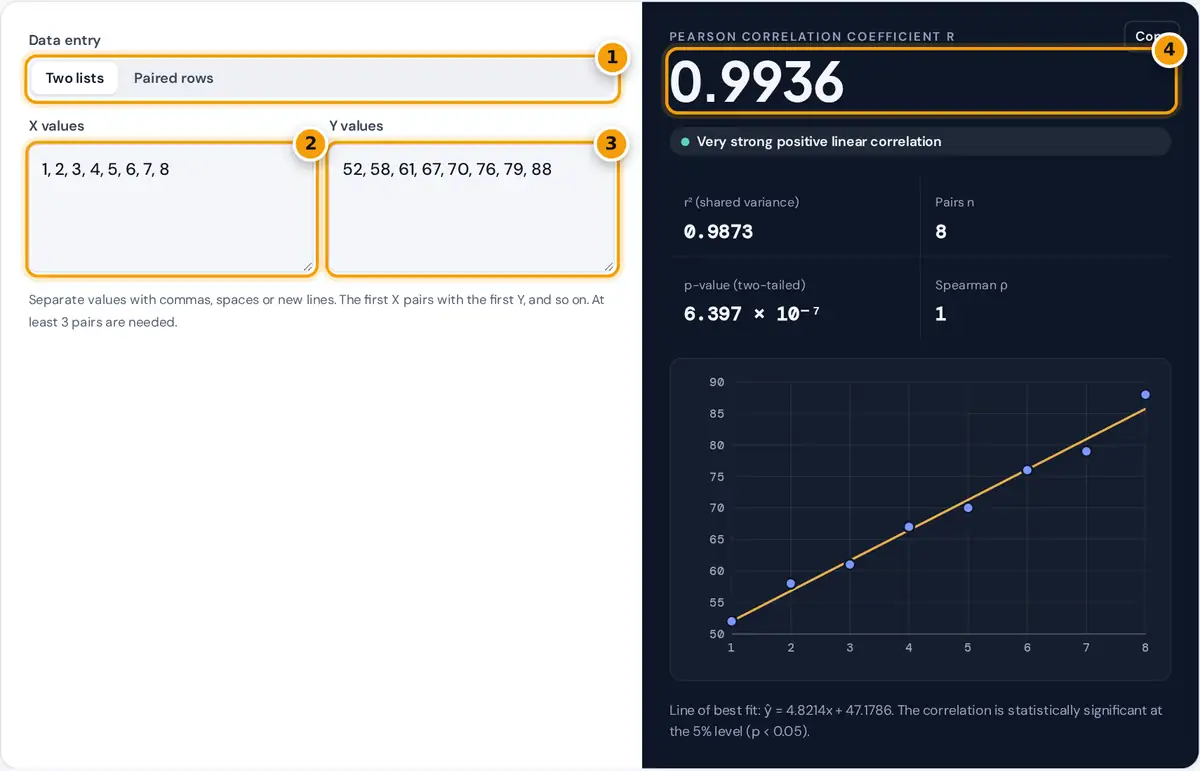
- Choose two lists, or paste paired rows from a spreadsheet.
- Enter the X values, separated by commas, spaces or new lines.
- Enter the matching Y values in the same order.
- Read r with its strength label, r squared, p-value and Spearman rho.
Enter your X values in the first box and the matching Y values in the second, separated by commas, spaces or line breaks. The first X pairs with the first Y, the second with the second, and so on. If your data is in a spreadsheet, choose Paired rows and paste the two columns directly; a header row is skipped automatically.
The result panel shows Pearson’s r with a plain-English strength label, r squared, the number of pairs, a two-tailed p-value and Spearman’s rank correlation. The scatter plot draws the least squares line so you can see whether a straight line describes the data. Below the tool, a full table lists every deviation, product and square used in the formula.
Pearson Correlation Formula
t = r √(n − 2) ÷ √(1 − r²), with n − 2 degrees of freedom
The numerator, Sxy, is positive when large x values tend to go with large y values and negative when they go with small ones. Dividing by the square root of Sxx Syy scales the result so that r always lies between −1 and +1. Spearman’s ρ applies the same formula to the ranks of the data instead of the raw values.
Worked Example
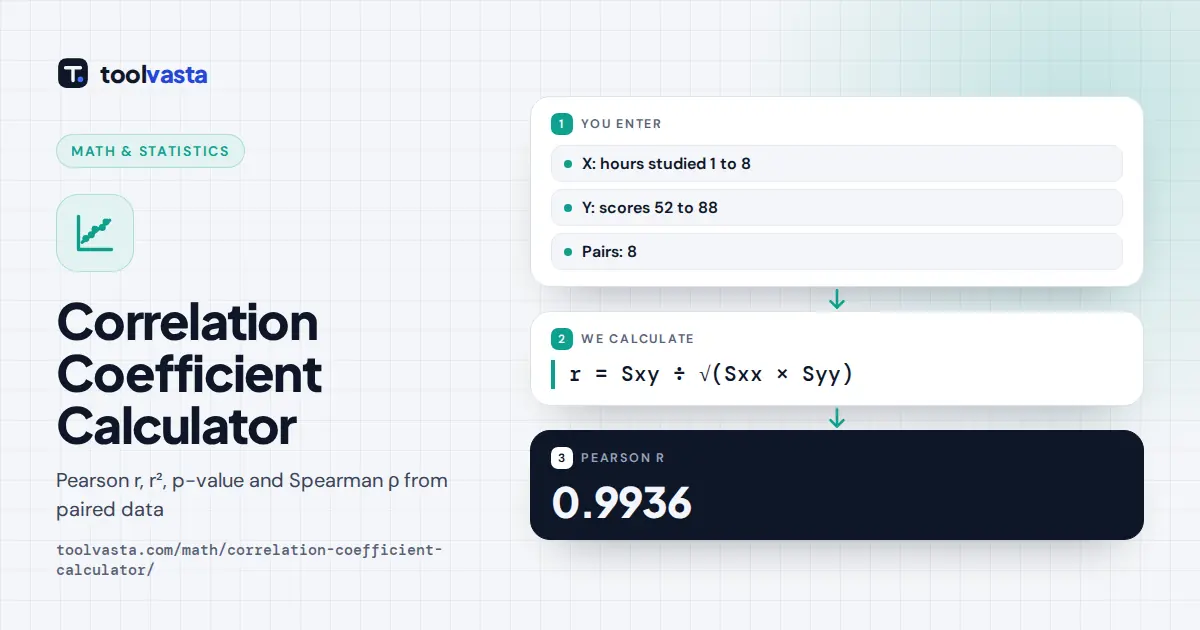
Eight students record hours studied (x = 1 to 8) and exam scores (y = 52, 58, 61, 67, 70, 76, 79, 88).
- Means: x̄ = 36 ÷ 8 = 4.5 and ȳ = 551 ÷ 8 = 68.875.
- Sums of products and squares: Sxy = 202.5, Sxx = 42 and Syy = 988.875.
- r = 202.5 ÷ √(42 × 988.875) = 202.5 ÷ 203.7973 = 0.9936.
- r² = 0.9873, so about 98.7% of the variation in scores is explained by a straight-line relationship with hours.
- t = 21.617 with 6 degrees of freedom, giving p ≈ 6.4 × 10⁻⁷.
Because the scores rise every time the hours rise, Spearman’s ρ is exactly 1.
How to Interpret Correlation Strength
| |r| | Common description |
|---|---|
| 0.00 to 0.19 | Very weak |
| 0.20 to 0.39 | Weak |
| 0.40 to 0.59 | Moderate |
| 0.60 to 0.79 | Strong |
| 0.80 to 1.00 | Very strong |
These bands are a widely used rule of thumb, not a fixed standard, and different fields use different cutoffs. The sign gives the direction: positive means both variables rise together, negative means one falls as the other rises. Always look at the scatter plot too, because a single outlier can create or hide a correlation.
Pearson or Spearman?
Use Pearson’s r for two numeric variables with a roughly linear relationship and no extreme outliers. Use Spearman’s ρ for ranked data, for relationships that are consistently increasing or decreasing but curved, or when outliers are a concern. When the two values differ a lot, the relationship is probably not a straight line.
How to Report a Correlation
In a report, give the coefficient, the sample size and the p-value together, for example: “Hours studied and exam score were strongly positively correlated, r(6) = 0.99, p < 0.001.” The number in brackets is the degrees of freedom, n − 2. State which coefficient you used, Pearson or Spearman, and include the scatter plot whenever you can, because readers can judge the pattern far better from the picture than from a single number.
Limits and Cautions
- Correlation is not causation. A third factor can drive both variables.
- r only measures linear association. A perfect U-shaped pattern can have r close to 0.
- The p-value assumes the pairs are independent and roughly bivariate normal. With very small samples, even a large r may not be significant.
- The calculator needs at least 3 pairs and some variation in both X and Y.
For more background on correlation and regression, see the NIST/SEMATECH e-Handbook of Statistical Methods.
Frequently asked questions
What does a correlation coefficient tell you?
It measures how closely two variables follow a straight-line relationship. Values near +1 or minus 1 mean a strong linear relationship, and values near 0 mean little or no linear relationship between them.
What is a good correlation coefficient?
It depends on the field. A common rule of thumb calls an absolute value of 0.6 to 0.79 strong and 0.8 or more very strong, but in noisy areas such as social science, 0.3 can be meaningful.
What is the difference between r and r squared?
r gives the strength and direction of a linear relationship. r squared, the coefficient of determination, is the proportion of the variation in Y that a straight line on X accounts for.
Can the correlation coefficient be greater than 1?
No. Pearson's r always lies between minus 1 and plus 1. A value outside that range means a calculation error, often from mixing sample and population formulas in different parts.
When should I use Spearman instead of Pearson?
Use Spearman for ranked or ordinal data, for curved but consistently rising or falling relationships, or when outliers are present. It correlates the ranks of the values instead of the values themselves.
What does the p-value mean for a correlation?
It is the probability of seeing a correlation at least this strong if the true correlation were zero. A p-value below 0.05 is usually called statistically significant at the 5% level.