How to Use the Average Percentage Calculator
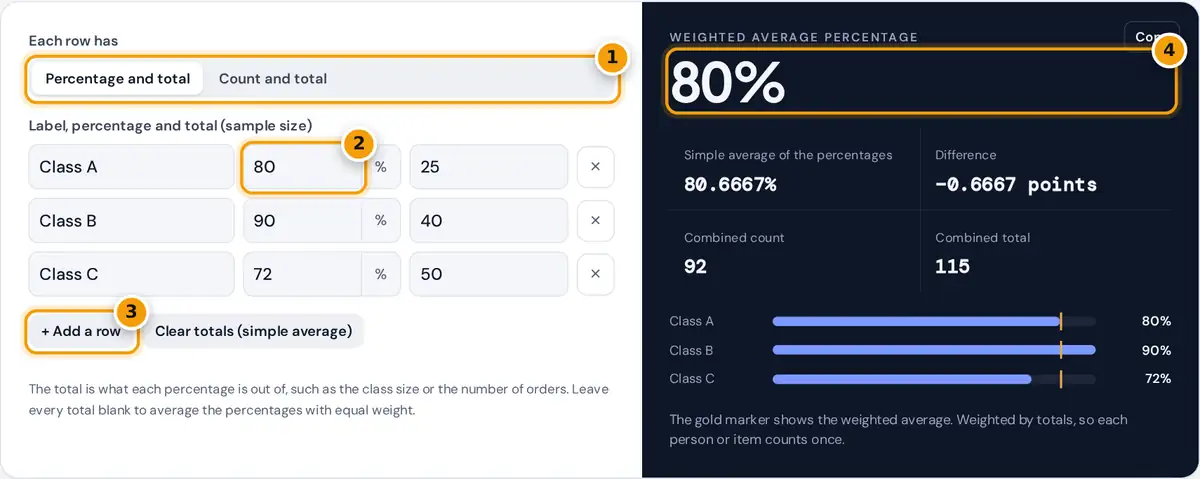
- Choose whether each row has a percentage or a count, plus its total.
- Enter each percentage and the total it is out of, such as the class size.
- Add as many rows as you need.
- Read the weighted average next to the simple average and the difference.
Enter one row per group. In Percentage and total mode, type the percentage and the total it is based on, for example 80% of a class of 25 students. In Count and total mode, type the raw count and the total instead, such as 45 yes answers out of 60, and the percentage is worked out for you. Add as many rows as you need, and give each one a label if you like.
The result panel shows the weighted average percentage, which is the true overall percentage, next to the simple average of the percentages and the gap between them. Bars compare each group with the overall figure. The steps and table below show every count, total and weight. If you leave all totals blank, the calculator averages the percentages with equal weight.
Average Percentage Formula
= total count ÷ total size × 100
Simple average % = (p₁ + p₂ + … + pk) ÷ k
Here p is each percentage and n is the total it was measured on. The weighted formula is the same as pooling everyone together and taking one percentage, so each person or item counts exactly once.
Worked Example
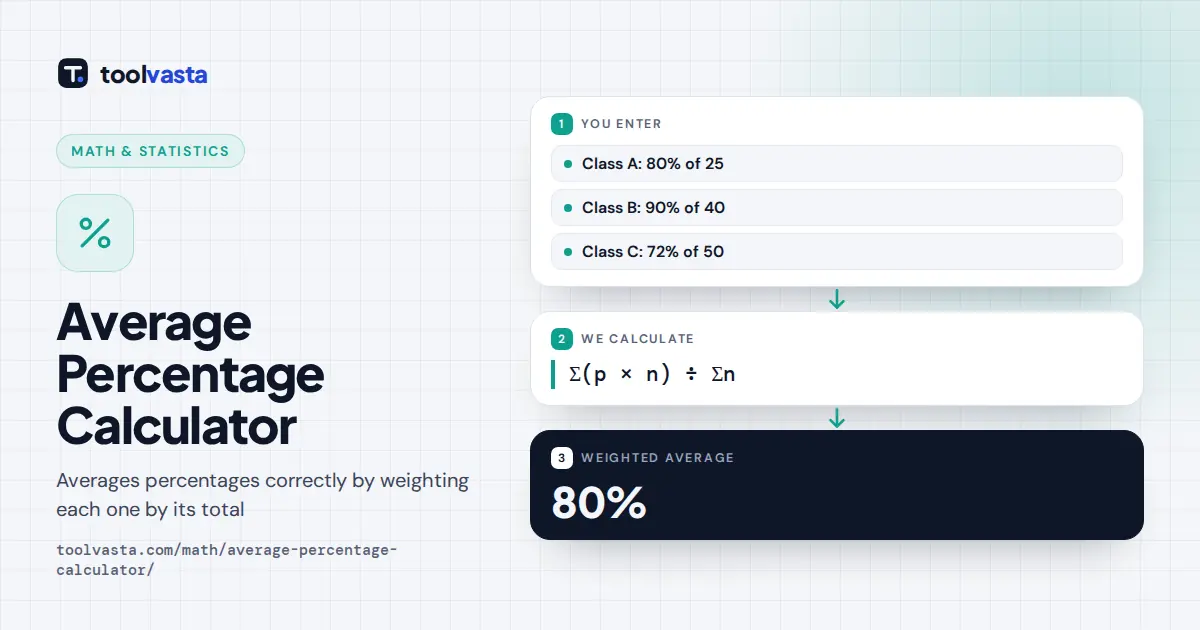
Three classes score 80% (25 students), 90% (40 students) and 72% (50 students) on a test. Convert to counts: 0.80 × 25 = 20, 0.90 × 40 = 36 and 0.72 × 50 = 36. In total, 92 of 115 students passed, so the overall pass rate is 92 ÷ 115 = 80%.
The simple average of the three percentages is (80 + 90 + 72) ÷ 3 = 80.6667%, which overstates the true figure by 0.6667 percentage points because the smallest class has a high score and the largest class a low one.
When to Use Each Average
| Situation | Use |
|---|---|
| Combining pass rates, conversion rates or survey results from groups of different sizes | Weighted average |
| Overall percentage of a whole population split into parts | Weighted average |
| Averaging scores on tests that all count equally toward a grade | Simple average |
| Groups are all the same size | Either, they give the same answer |
The Common Mistake
Averaging percentages directly treats a group of 5 the same as a group of 500. If a store converts 50% of 10 visitors on Monday and 10% of 1,000 visitors on Tuesday, the simple average says 30%, but the real conversion rate over both days is 105 ÷ 1,010 ≈ 10.40%. Whenever the groups differ in size, go back to the counts.
Percentage Points or Percent?
The gap between two percentages is best described in percentage points. In the worked example, the simple average of 80.6667% is 0.6667 percentage points above the true 80%. As a relative difference that is 0.6667 ÷ 80 ≈ 0.83%, which sounds much smaller. Reports that mix the two terms can mislead, so the calculator states the difference in points.
Starting From Counts
If your data are raw counts, such as 45 yes answers out of 60, 30 out of 40 and 12 out of 20, switch to Count and total. The weighted percentage is simply (45 + 30 + 12) ÷ (60 + 40 + 20) = 87 ÷ 120 = 72.5%, while the simple average of 75%, 75% and 60% is 70%. Pooling the counts always gives the weighted answer directly.
Tips and Limits
- Percentages above 100%, such as growth rates, are allowed, but averaging growth rates over time usually needs a geometric mean instead.
- Totals can be decimals, for example amounts in dollars, when the percentage is a share of an amount.
- All arithmetic is exact, and results are rounded to four decimal places only for display.
Frequently asked questions
How do you calculate the average of percentages?
If the groups differ in size, multiply each percentage by its total to get a count, add the counts, add the totals, and divide. That gives the true overall percentage.
Can you just add percentages and divide?
Only when every percentage is based on the same total. Otherwise the simple average gives small groups too much weight and can be noticeably wrong.
What is a weighted average percentage?
An average where each percentage counts in proportion to the size of the group it came from. It equals the percentage you would get by pooling all the groups together.
How do I find the overall percentage from several groups?
Add the number of successes in all groups and divide by the total size of all groups, then multiply by 100. For 20 of 25, 36 of 40 and 36 of 50, that is 92 ÷ 115 = 80%.
Why is the simple average different from the weighted average?
Because the groups have different sizes. If a small group has an unusually high or low percentage, the simple average is pulled toward it, while the weighted average is not.
What if I do not know the group sizes?
Then you can only take the simple average, which assumes equal-sized groups. Leave all totals blank and the calculator does this, but treat the result with care.