How to Use the ANOVA Calculator
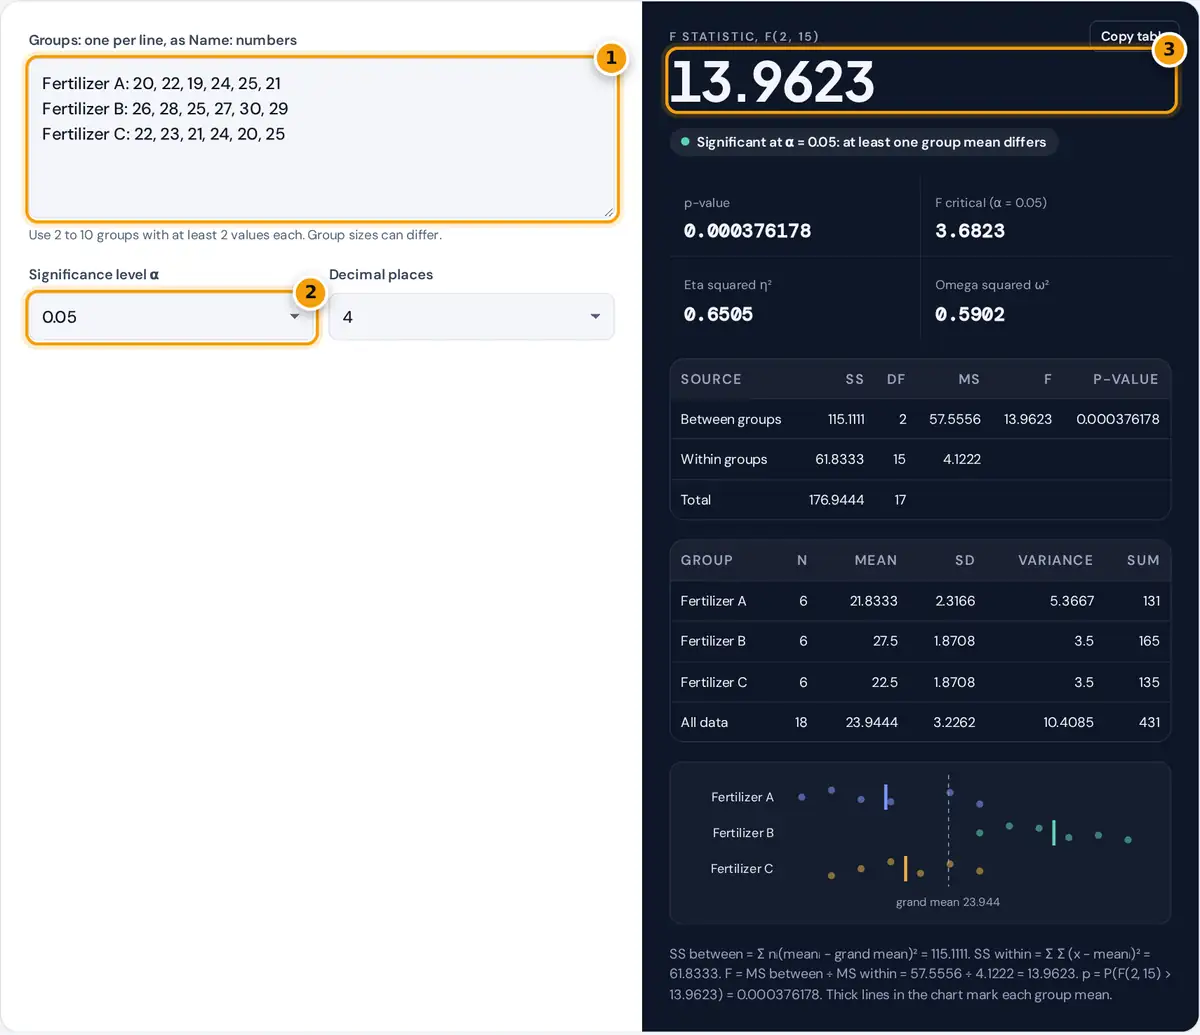
- Enter each group on its own line as Name: values. Group sizes can differ.
- Choose the significance level, usually 0.05, and the decimal places.
- Read F, the p-value and the verdict, then the ANOVA table and group summary.
Type each group on its own line as a name, a colon and the values, for example “Fertilizer A: 20, 22, 19”. Values can be separated by commas or spaces, and the groups can have different sizes. You need at least two groups with at least two values each.
Choose the significance level, usually 0.05, and the number of decimal places. The F statistic, p-value and a plain-language verdict appear at once. Below them you get the full ANOVA table, a summary of each group, and a dot plot with every group mean marked so you can see where the difference lies. Copy table copies the ANOVA table as tab-separated text that pastes neatly into a spreadsheet.
One-Way ANOVA Formulas
SS within = ΣΣ(x − x̄ᵢ)² df within = N − k
MS = SS ÷ df F = MS between ÷ MS within
p = P(F(k − 1, N − k) > F) η² = SS between ÷ SS total
Here k is the number of groups, N is the total number of values, x̄ᵢ is the mean of group i and x̄ is the grand mean. ANOVA compares the spread between the group means with the spread inside the groups. If the means really are equal, both mean squares estimate the same variance and F is close to 1. A large F means the groups differ more than random variation would explain.
Worked Example
Three fertilizers were each tested on six plots, giving the yields in the default data. The group means are 21.8333, 27.5 and 22.5, and the grand mean is 23.9444.
| Source | SS | df | MS | F | p-value |
|---|---|---|---|---|---|
| Between groups | 115.1111 | 2 | 57.5556 | 13.9623 | 0.000376 |
| Within groups | 61.8333 | 15 | 4.1222 | ||
| Total | 176.9444 | 17 |
The critical value of F(2, 15) at α = 0.05 is 3.6823. Because F = 13.96 is far larger and p = 0.000376 is below 0.05, we reject the hypothesis that all three fertilizers give the same mean yield. Eta squared is 0.6505, so about 65 percent of the variation in yield is explained by the fertilizer.
Reading the Result
A significant result tells you that at least one group mean differs from the others. It does not say which one. Look at the group means and the dot plot, then run a post hoc test such as Tukey’s HSD, or pairwise t-tests with a Bonferroni correction, to find the specific pairs that differ.
Effect size matters as much as the p-value. A common rule of thumb treats η² of about 0.01 as small, 0.06 as medium and 0.14 as large. Omega squared, ω², is a less biased estimate of the same quantity and is always a little smaller.
Why Not Run Several t-Tests?
With three groups you could compare A with B, A with C and B with C using three separate t-tests. The problem is that each test carries its own 5 percent chance of a false positive, so the chance of at least one false alarm across all three is about 14 percent, and it keeps rising with more groups. One-way ANOVA tests all the means at once with a single, controlled error rate. Only after a significant ANOVA should you move on to pairwise comparisons with a correction.
With exactly two groups, one-way ANOVA and the pooled two-sample t-test are equivalent: F equals t squared and the p-values match.
Assumptions and Limits
- Observations are independent, both within and between groups.
- Each group comes from a roughly normal population. ANOVA is fairly robust to mild departures when groups are of similar size.
- The groups have similar variances. As a rough check, the largest standard deviation should be no more than about twice the smallest. If not, consider Welch’s ANOVA.
- This page runs one-way ANOVA with a single factor. Two-way and repeated measures designs need a different model.
The NIST/SEMATECH e-Handbook of Statistical Methods gives a fuller treatment of one-way ANOVA.
Frequently asked questions
What does a one-way ANOVA test?
It tests whether the means of two or more independent groups are all equal. The null hypothesis is that every group has the same population mean; the alternative is that at least one mean is different.
How do I interpret the p-value in ANOVA?
If the p-value is below your significance level, usually 0.05, the differences between group means are larger than chance alone would likely produce, so you reject the hypothesis that all means are equal.
What is the F statistic?
F is the mean square between groups divided by the mean square within groups. Values near 1 suggest the group means are similar, while large values suggest that real differences exist between the groups.
How is the F critical value used?
The critical value is the point on the F distribution with the chosen tail area. If your F statistic exceeds it, the result is significant at that level. This is equivalent to the p-value being below α.
Can the groups have different sizes?
Yes. One-way ANOVA works with unequal group sizes. The calculator weights each group mean by its size when computing the between-groups sum of squares and uses N minus k within-group degrees of freedom.
What should I do after a significant ANOVA?
Run a post hoc test such as Tukey's HSD or Bonferroni-corrected pairwise t-tests to find which groups differ, and report an effect size such as eta squared along with F and the p-value.