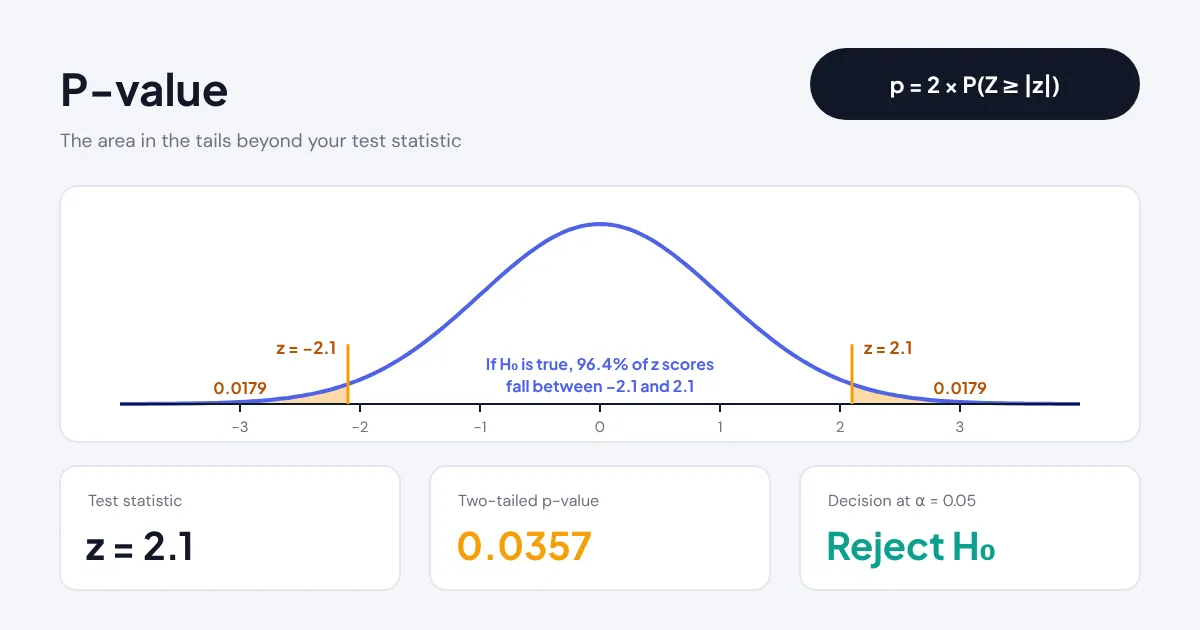
Quick answer: A p-value is the probability of getting a test statistic at least as extreme as yours if the null hypothesis were true. This p value calculator turns a z, t, chi-square or F statistic into that probability. For z = 2.1, two-tailed, p = 2 × 0.0179 = 0.0357, which is significant at α = 0.05.
What Does a P-Value Tell You?
A p value calculator converts the test statistic from a hypothesis test into a p-value, so you can decide whether a result is statistically significant without looking anything up in a printed table. It supports the four distributions behind almost every introductory test: the standard normal (z tests), Student's t (t tests), chi-square (goodness of fit and independence tests) and F (ANOVA and variance ratio tests).
Along with the p-value it reports the area to the left and right of your statistic, the critical value for your chosen significance level, a plain reject or fail to reject decision, and a curve with the p-value area shaded. Degrees of freedom can be decimals, which covers the Welch t test. If you still need the statistic itself, the z score calculator computes z from raw data and the ANOVA calculator produces the F statistic and its degrees of freedom.
How Do You Turn a Test Statistic into a P-Value?

- Pick the distribution that matches your test: z score, t score, chi-square or F statistic.
- Enter the test statistic, and the degrees of freedom if the distribution needs them (two values for F).
- Choose the hypothesis: two-tailed for ≠, right-tailed for >, left-tailed for <. Chi-square and F switch to right-tailed automatically, which is the usual setup.
- Pick the significance level α, most often 0.05.
- Read the p-value, the decision, the critical value and the shaded curve.
Very small p-values are shown in scientific notation, for example 4.02e-11, instead of being rounded to zero.
How Is a P-Value Calculated?
A p-value is a tail area under the sampling distribution of the test statistic, worked out from that distribution's cumulative distribution function (CDF). The tail you use depends on the alternative hypothesis.
Left-tailed: p = P(T ≤ tobs) = CDF(tobs)
Two-tailed: p = 2 × min(CDF(tobs), 1 − CDF(tobs))
Reject H0 when p ≤ α
Worked example (t test): a sample of 16 coffee cups has a mean fill 2.1 standard errors above the advertised amount, so t = 2.1 with df = 16 − 1 = 15. The right-tail area under the t distribution with 15 degrees of freedom is 0.0265, and doubling it gives a two-tailed p-value of 0.0531. That is just above 0.05, so at the 5% level you would fail to reject the null hypothesis, even though the same z score would have been significant. The heavier tails of the t distribution make the difference.
Worked example (chi-square): a test of independence on a 3 × 3 table gives χ² = 9.5 with df = (3 − 1)(3 − 1) = 4. The right-tail area is 0.0497, just under 0.05, and the critical value at α = 0.05 is 9.488. The calculator computes exact CDFs with the incomplete beta and gamma functions rather than table lookups, and its results match standard statistical software to at least 8 significant figures. You can cross-check t critical values against the NIST Engineering Statistics Handbook table of t distribution critical values.
How Do You Read a P-Value?
Read a p-value as a measure of how surprising your data would be if there were really no effect. A small p-value means the data would be unusual under the null hypothesis; it does not tell you the size or importance of the effect.

| p-value | Common wording | Decision at α = 0.05 |
|---|---|---|
| p > 0.10 | No evidence against H0 | Fail to reject |
| 0.05 < p ≤ 0.10 | Weak evidence, sometimes called marginal | Fail to reject |
| 0.01 < p ≤ 0.05 | Evidence against H0, significant | Reject |
| 0.001 < p ≤ 0.01 | Strong evidence | Reject |
| p ≤ 0.001 | Very strong evidence | Reject |
The American Statistical Association statement on p-values warns against treating 0.05 as a bright line: report the exact p-value, the effect size and a confidence interval together. Planning enough data in advance with the sample size calculator also makes a real effect much more likely to show up.
One-Tailed or Two-Tailed: Which Should You Use?
Use a two-tailed test unless you decided before collecting data that only one direction matters. A two-tailed p-value is twice the one-tailed value for z and t, so switching after seeing the results halves the p-value and overstates the evidence.
Chi-square and F tests are almost always right-tailed, because larger values mean a bigger departure from the null hypothesis. A left-tailed chi-square test is used only for special questions, such as checking whether data fit a model suspiciously well. For critical values without a p-value, the t table calculator gives them for any degrees of freedom.
Related Tools
- Z Score Calculator
- T Table Calculator
- ANOVA Calculator
- Sample Size Calculator
- Standard Deviation Calculator
- Correlation Coefficient Calculator
Frequently asked questions
How do you calculate a p-value from a z score?
Find the area beyond z under the standard normal curve. For a two-tailed test, double the smaller tail. z = 1.96 gives a right tail of 0.025 and a two-tailed p-value of 0.05.
How do you find a p-value from a t score?
Use the t distribution with the right degrees of freedom, usually n − 1 for a one-sample test. Enter t and df above and pick the tail; the calculator does the integration.
What does p < 0.05 mean?
If the null hypothesis were true, a result at least this extreme would happen less than 5% of the time. It does not mean there is a 95% chance your hypothesis is right.
Can a p-value be 0?
Not exactly. It can be extremely small, such as 4e-11 for z = 6.5, and software may round it to 0.0000. Report it as p < 0.001 instead.
Why is my chi-square p-value right-tailed?
A chi-square statistic grows as observed counts move away from expected counts, so only large values count as evidence against H0. The p-value is the area to the right.
What is the difference between the p-value and alpha?
Alpha is the threshold you pick before the test, usually 0.05. The p-value comes from your data. You reject the null hypothesis when the p-value is less than or equal to alpha.