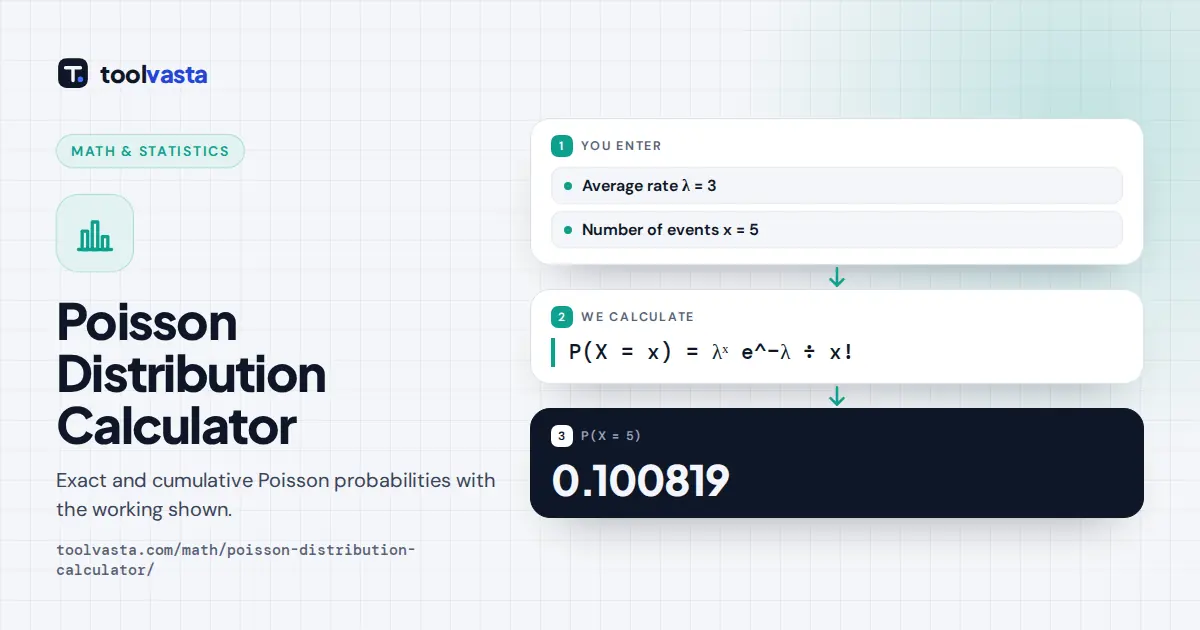
How to use the Poisson distribution calculator
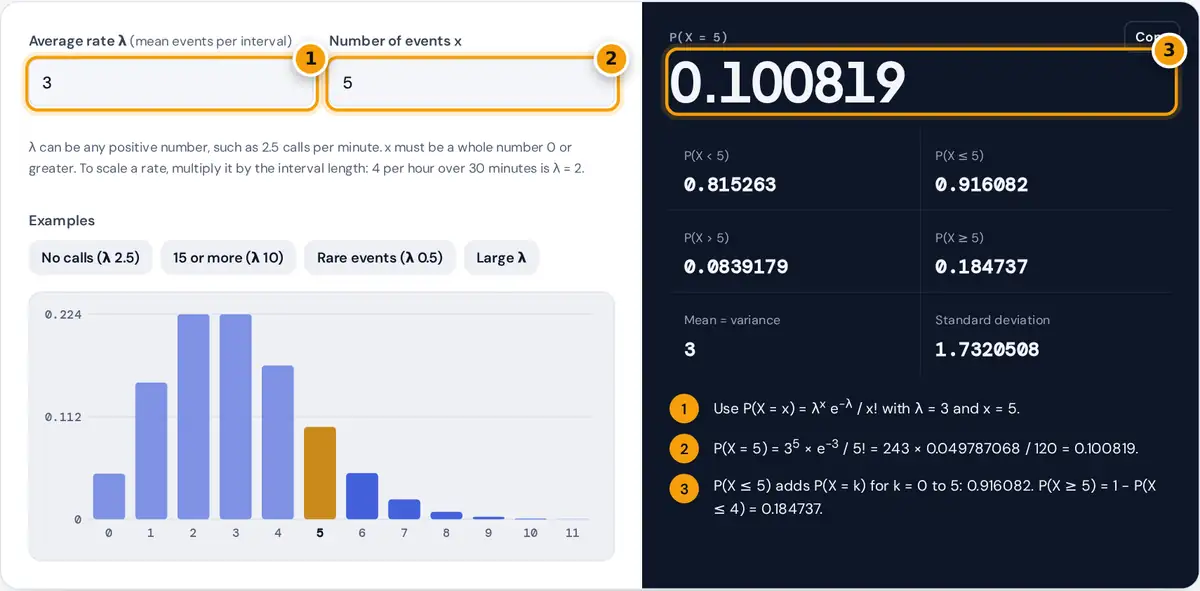
- Enter the average rate λ, the mean number of events per interval.
- Enter the number of events x, a whole number 0 or greater.
- Read P(X = x), then the cumulative probabilities, mean and standard deviation.
Enter the average number of events in your interval, λ (lambda), and the number of events x you are interested in. The Poisson probability calculator returns the exact probability P(X = x) and the four cumulative probabilities: fewer than x, at most x, more than x and at least x. The chart highlights x within the whole distribution, and the table lists every value near the mean.
If your rate is given for a different interval, scale it first. For example, if a help desk gets 12 calls per hour and you care about a 15-minute window, λ = 12 × 0.25 = 3.
Poisson distribution formula
P(X ≤ x) = Σk=0x λk e−λ / k!
Mean = Variance = λ, Standard deviation = √λ
The Poisson distribution models the number of independent events in a fixed interval of time or space when events happen at a constant average rate. Typical examples are calls to a call centre, typos per page, arrivals at a store, radioactive decays and defects per square metre.
Worked example
A shop averages 3 customers every 10 minutes. What is the probability that exactly 5 arrive in the next 10 minutes?
- λ = 3 and x = 5.
- P(X = 5) = 35 × e−3 / 5! = 243 × 0.0497871 / 120 = 0.100819.
- P(X ≤ 5) = 0.916082, so P(X > 5) = 0.083918.
- P(X ≥ 5) = 1 − P(X ≤ 4) = 1 − 0.815263 = 0.184737.
So there is about a 10% chance of exactly five customers and about an 18% chance of five or more.
Probabilities for λ = 3
| x | P(X = x) | P(X ≤ x) |
|---|---|---|
| 0 | 0.049787 | 0.049787 |
| 1 | 0.149361 | 0.199148 |
| 2 | 0.224042 | 0.423190 |
| 3 | 0.224042 | 0.647232 |
| 4 | 0.168031 | 0.815263 |
| 5 | 0.100819 | 0.916082 |
When the Poisson model applies
- Events occur one at a time and independently of each other.
- The average rate is constant across the interval.
- Two events cannot happen at exactly the same instant.
When the variance of real counts is much larger than the mean, the data is overdispersed and a negative binomial model fits better. For large λ, the Poisson distribution is close to a normal distribution with mean λ and standard deviation √λ. The Poisson distribution is also the limit of the binomial distribution with many trials n and a small success probability p, with λ = np.
Accuracy
Probabilities are computed with logarithms so that large λ and x do not overflow, and the tail probabilities are summed directly rather than as 1 minus a number close to 1. That keeps very small tail probabilities accurate. λ is limited to 1,000,000.
Frequently asked questions
What is the Poisson distribution used for?
It gives the probability of a number of events in a fixed interval when they occur independently at a known average rate, such as calls per hour, accidents per month or emails per day.
What does lambda mean in a Poisson distribution?
λ is the average number of events in the interval. It is both the mean and the variance of the distribution.
What is the difference between P(X < x) and P(X ≤ x)?
P(X < x) excludes x itself, while P(X ≤ x) includes it. They differ by exactly P(X = x).
How do I find the probability of at least one event?
Use P(X ≥ 1) = 1 − P(X = 0) = 1 − e−λ. With λ = 2.5, that is 1 − 0.0821 = 0.9179.
Can lambda be a decimal?
Yes. λ is an average, so it can be any positive number. The count x must be a whole number.