How to Use the Variance Calculator
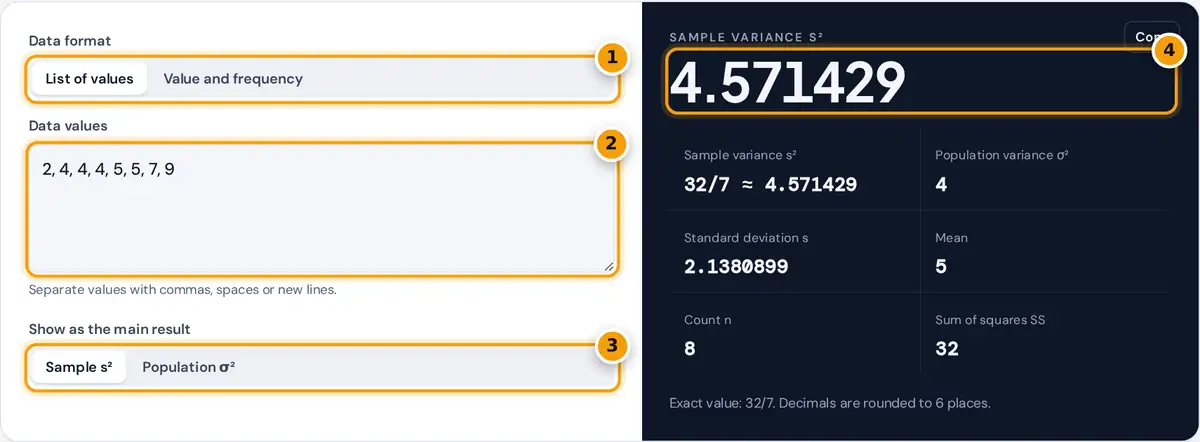
- Choose a list of values or a value and frequency table.
- Type or paste the data values.
- Choose which variance to show as the main result.
- Read the variance, then the exact fraction and both formulas worked out.
Choose List of values and type or paste your data, or choose Value and frequency to enter a frequency table with one value and its count on each line. The calculator shows the sample variance s² and the population variance σ² side by side, along with the standard deviation, mean, count and sum of squares. Use the switch to pick which variance appears as the main result.
Because the arithmetic is done with exact fractions, answers such as 32/7 are shown exactly with a rounded decimal next to them. Below the tool, the definition method and the shortcut formula are both worked out with your numbers, and a table lists every deviation and squared deviation.
Variance Formulas
Sample: s² = Σ(x − x̄)² ÷ (n − 1)
Shortcut: SS = Σx² − (Σx)² ÷ n
Frequency table: replace each sum with Σf·x, Σf·x² and n = Σf
Variance is the average squared distance from the mean. Squaring stops positive and negative deviations from cancelling and gives extra weight to values far from the center. The sample version divides by n − 1 so that, on average, it estimates the population variance without bias.
Worked Example
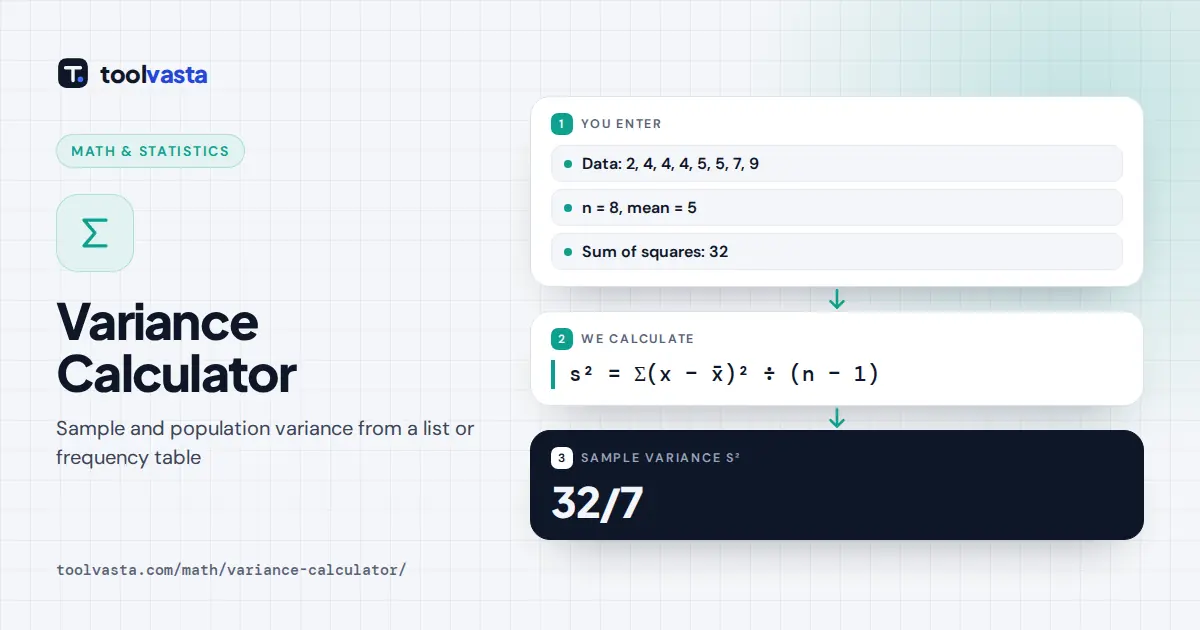
Find the variance of 2, 4, 4, 4, 5, 5, 7 and 9.
- n = 8 and Σx = 40, so the mean is 40 ÷ 8 = 5.
- Deviations: −3, −1, −1, −1, 0, 0, 2 and 4. Their squares are 9, 1, 1, 1, 0, 0, 4 and 16, so SS = 32.
- Population variance: σ² = 32 ÷ 8 = 4, so σ = 2.
- Sample variance: s² = 32 ÷ 7 = 32/7 ≈ 4.571429, so s ≈ 2.13809.
With the shortcut formula, Σx² = 232 and SS = 232 − 40² ÷ 8 = 232 − 200 = 32, the same answer with fewer subtractions.
Frequency table example
Twenty households report the number of pets: 0 (4 times), 1 (7 times), 2 (5 times), 3 (3 times) and 4 (once). Then n = 20, Σf·x = 30 and the mean is 1.5. Σf·x² = 0 + 7 + 20 + 27 + 16 = 70, so SS = 70 − 30² ÷ 20 = 25. The sample variance is 25 ÷ 19 = 25/19 ≈ 1.315789 and the population variance is 25 ÷ 20 = 1.25.
Sample and Population Variance Compared
| Data | SS | s² (n − 1) | σ² (N) |
|---|---|---|---|
| 2, 4, 4, 4, 5, 5, 7, 9 | 32 | 32/7 ≈ 4.5714 | 4 |
| Pets frequency table | 25 | 25/19 ≈ 1.3158 | 1.25 |
| 1, 2, 3, 4, 5 | 10 | 2.5 | 2 |
The sample variance is always the larger of the two, by a factor of n ÷ (n − 1). The gap is big for small data sets and almost disappears for large ones.
Why Variance Matters
Variance is the building block of much of statistics. Standard deviation, standard error, analysis of variance (ANOVA), regression and the chi-square test all start from sums of squared deviations. Variances also add in a useful way: for independent quantities, the variance of a sum is the sum of the variances, which is why risk in finance and measurement error in science are often combined using variance rather than standard deviation. Because it is in squared units, variance itself is less intuitive to read, so most reports quote the standard deviation and keep the variance for calculations. When you compare two data sets, a larger variance always means a larger spread around the mean.
Tips and Common Mistakes
- Do not forget to square the deviations. Plain deviations from the mean always add up to zero.
- In the shortcut formula, square the sum, (Σx)², rather than summing the squares twice.
- For a frequency table, n is the total of the frequencies, not the number of rows.
- Variance is in squared units, such as cm². Take the square root to return to the original units.
The NIST/SEMATECH e-Handbook of Statistical Methods gives further background on measures of spread.
Frequently asked questions
What is variance in statistics?
Variance measures how far a set of values spreads out from its mean. It is the average of the squared deviations from the mean, so larger values mean the data is more spread out.
What is the difference between sample and population variance?
Population variance divides the sum of squared deviations by N, the number of values. Sample variance divides by n minus 1, which corrects the tendency of a sample to underestimate the spread.
How do you calculate variance from a frequency table?
Multiply each value and each squared value by its frequency, add them to get the sums, use the total frequency as n, then apply the usual formula or the shortcut formula.
What is the shortcut formula for variance?
The sum of squares equals the sum of x squared minus the square of the sum divided by n. Divide that by n minus 1 for a sample or by n for a population.
Why is variance in squared units?
Each deviation is squared before averaging, so the units are squared too. Heights in centimeters give a variance in square centimeters. The standard deviation, its square root, returns to centimeters.
Can variance be zero or negative?
Variance can be zero when every value is identical, but it can never be negative because it is an average of squared numbers, and squares are never below zero.