How to Use the Flowchart Maker
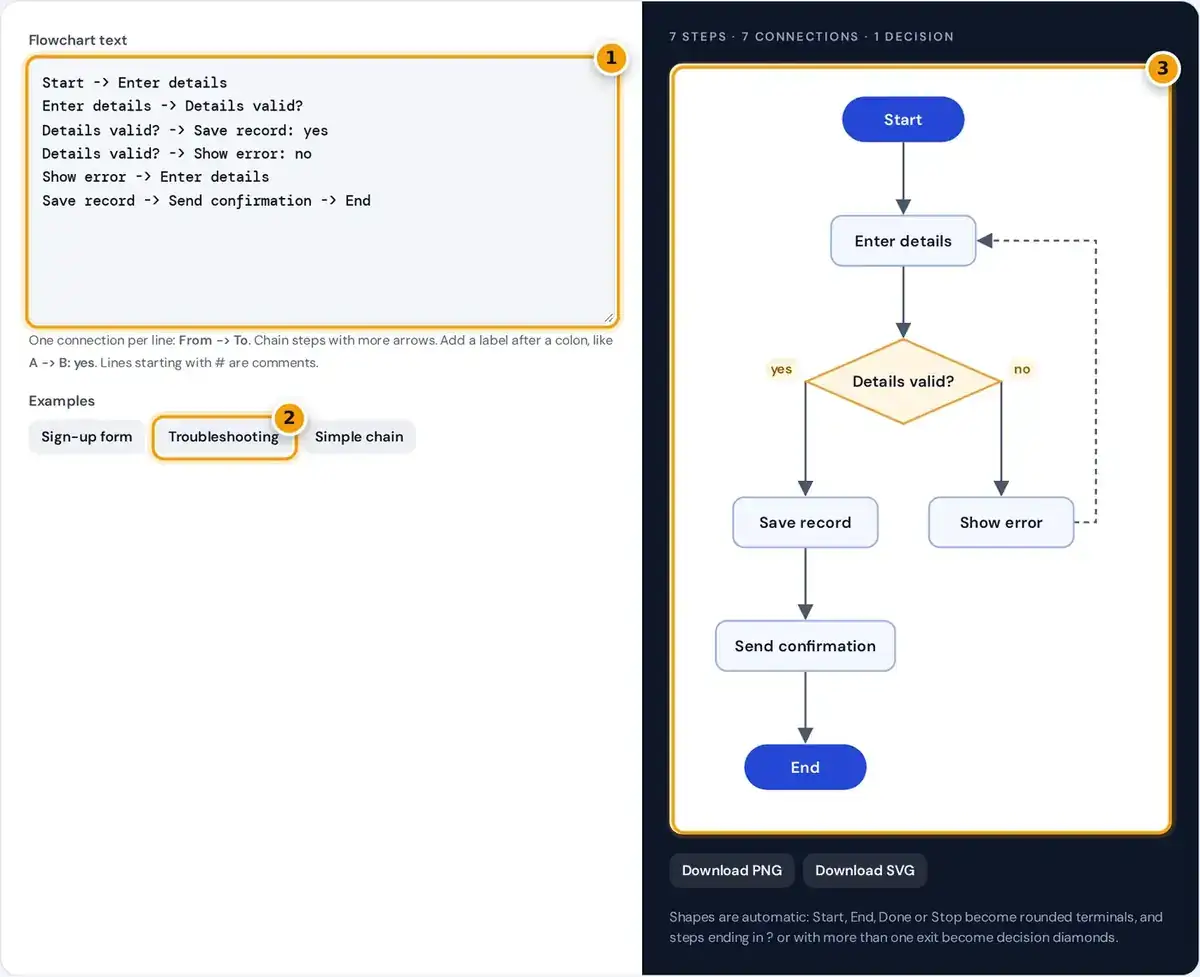
- Type one connection per line, like Start -> Check. Add a label after a colon, such as A -> B: yes.
- Or load an example such as Troubleshooting and edit it.
- Check the auto-laid-out chart: questions become diamonds, Start and End become terminals. Download PNG or SVG.
Type one connection per line in the text box, using an arrow made of a hyphen and a greater-than sign: Start -> Enter details. The diagram redraws as you type, with no dragging or aligning boxes.
Each step becomes a box the first time it appears. To connect to that step again, write the same spelling. Three examples, a sign-up form, a troubleshooting guide and a chain, load with one click.
When the chart looks right, download it as a PNG or SVG. This free flowchart maker needs no account and adds no watermark, so it works as a flowchart maker online free of any sign-ups.
Flowchart Text Syntax
The syntax is small. A line can hold a chain of several arrows, text after the last colon becomes the label on the final arrow, and lines starting with a hash are comment lines ignored.
Step A -> Step B -> Step C (a chain)
Question? -> Answer step: yes (labeled arrow)
# comment lines are ignored
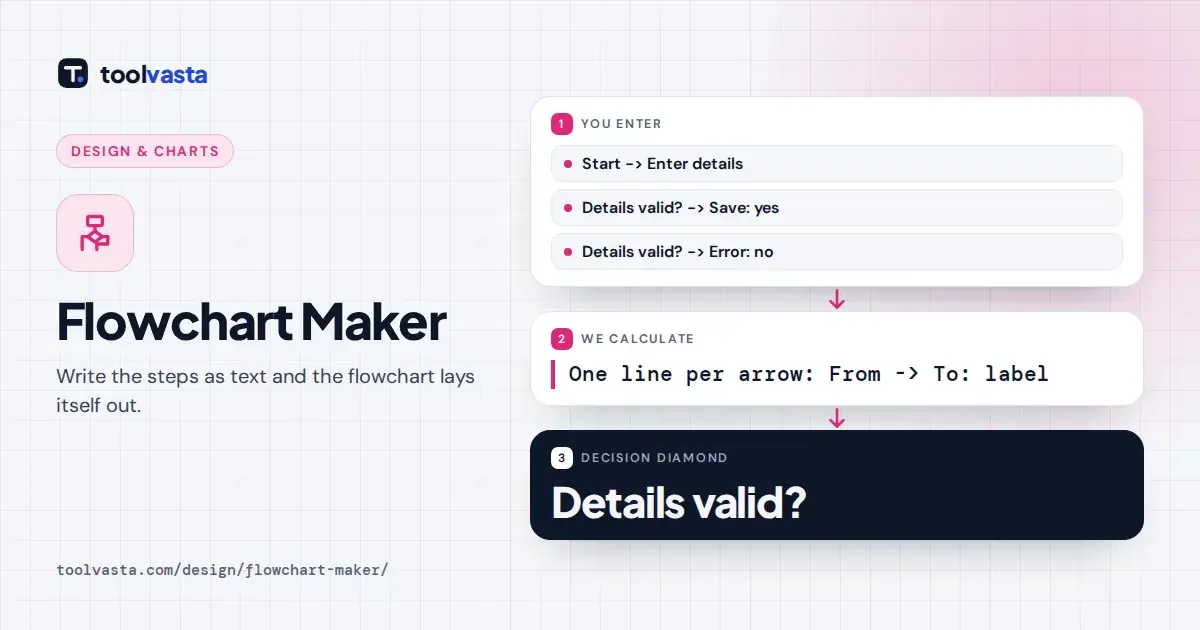
Labels are ideal for yes and no branches after a question. Write Details valid? -> Save record: yes on one line and Details valid? -> Show error: no on the next, and both arrows then appear labeled.
If a line has no arrow, or a step name is missing beside one, an error message names the line, such as Line 2, so you can fix the typo without hunting through the text.
What Is a Flowchart?
A flowchart is a diagram that shows a process as a sequence of steps joined by arrows. Boxes hold actions, diamonds hold decisions, and arrows show the order of every step, from start to finish.
Teams use flowcharts to document a workflow, train new staff, plan an algorithm before writing code, and find bottlenecks where work piles up. A clear chart often reveals missing steps that a written procedure hides.
Writing the chart as text is faster than drawing it. You think about the logic, not the geometry, and the tool handles positions, spacing and arrow routing for you, which keeps diagrams tidy and consistent.
Flowchart Symbols Used
The tool chooses flowchart symbols automatically, based on each step name and on how many connections leave it. The three shapes it draws follow the conventions of ISO 5807, the international standard for flowchart symbols.
| Shape | Meaning | When the tool uses it |
|---|---|---|
| Rounded terminal | Start or end of the process | Name begins with Start, End, Begin, Finish, Done or Stop |
| Diamond | Decision with two or more outcomes | Name ends with ? or the step has more than one exit |
| Rectangle | Process or action step | Every other step |
A rounded terminal marks start and end points. A decision diamond marks a question with several outcomes. Every other step becomes a process rectangle, and flow lines with arrowheads join them in the right order.
Fuller symbol sets add shapes such as input/output parallelograms and the wavy document symbol. Most everyday process maps only need the three core shapes, which keeps charts easy to read and scan for any audience.
How the Automatic Layout Works
The automatic layout arranges steps in rows from top to bottom, using the same layered approach as tools such as Graphviz. You never place a box by hand, so later edits never break the arrangement.
- Arrows are followed from the start, and any arrow that returns to a step already on the current path is marked as a back edge.
- Each step gets a row equal to the longest chain of forward arrows leading to it, so every forward arrow points down.
- Steps in each row are reordered a few times to sit near the steps that lead to them, which reduces crossing lines.
- Rows are spaced to fit the tallest shape, and arrows are drawn with right-angle bends.
Back edges form a loop, such as a retry after an error. They are drawn as a dashed line routed around the right side, so the main flow still reads cleanly from top to bottom.
Right-angle connectors keep the chart neat. Because positions are recalculated on every change, you can insert a step in the middle of a long process and the rest of the diagram shifts to make room.
Worked Example: A Sign-Up Form
The default worked example above describes a sign-up form with 7 steps, 7 connections and 1 decision. Start sits in row 1, Enter details in row 2 and the question Details valid? in row 3.
Save record and Show error both come from the decision, so they share row 4 with their yes and no labels. Send confirmation follows in row 5, and End finishes the chart in row 6.
The arrow from Show error back to Enter details points upward, so it becomes a dashed retry loop on the right. The status line above confirms the counts: 7 steps, 7 connections and 1 decision.
Tips for Readable Flowcharts
Start each step name with a verb, like Check stock, Send invoice or Approve request. Phrase each decision as a yes or no question and label both arrows, so nobody guesses which path is which.
Keep one start and at least one end, so readers know where to begin. Names wrap at about 20 characters, so short names keep boxes compact and the whole chart readable on a phone screen.
Split charts with more than about 20 steps into smaller sub-process charts. For work that passes between departments, a swimlane diagram in a full editor may suit you better. Keep wording and naming consistent throughout.
Downloading, Sharing and Privacy
Download PNG gives an image at twice the preview resolution, ready for Google Docs, Word or slides. The SVG download is a vector file that stays sharp at any size and opens in vector editors.
SVG is an open format defined by the W3C SVG specification, so Figma, Illustrator and Inkscape can edit the shapes and text. You can also embed it directly in a web page or blog post.
The diagram is built in your browser, and your text is never uploaded. Like diagram as code tools such as Mermaid, the text is the source: paste it back later and the flowchart reappears exactly.
Frequently asked questions
How do I add a yes or no label to an arrow?
Add a colon and the label at the end of the line, for example: Is it raining? -> Take umbrella: yes. Text after the last colon always becomes the label on the final arrow in that line.
How do I make a decision diamond?
End the step name with a question mark, or give the step two or more outgoing arrows. Either one makes it a decision diamond, and you can label each outgoing branch with a colon.
Can a flowchart loop back to an earlier step?
Yes. Write an arrow from the later step to the earlier one, such as Show error -> Enter details. It is drawn as a dashed line routed around the right side of the chart.
Is this flowchart maker free?
Yes. There is no account, watermark or download limit, and your diagram never leaves your browser. You can make as many flowcharts as you like and download each one as PNG or SVG.
Can I edit the downloaded flowchart?
The SVG download can be opened and edited in Figma, Illustrator, Inkscape or any vector editor. To change the structure, it is usually faster to edit the text here and download again.
How do I put a flowchart in Google Docs or Word?
Download the PNG, then insert it as an image in Google Docs, Word or your slides. For print or large screens, use the SVG instead, because vector graphics stay sharp at any size.