How to Use the Genogram Maker
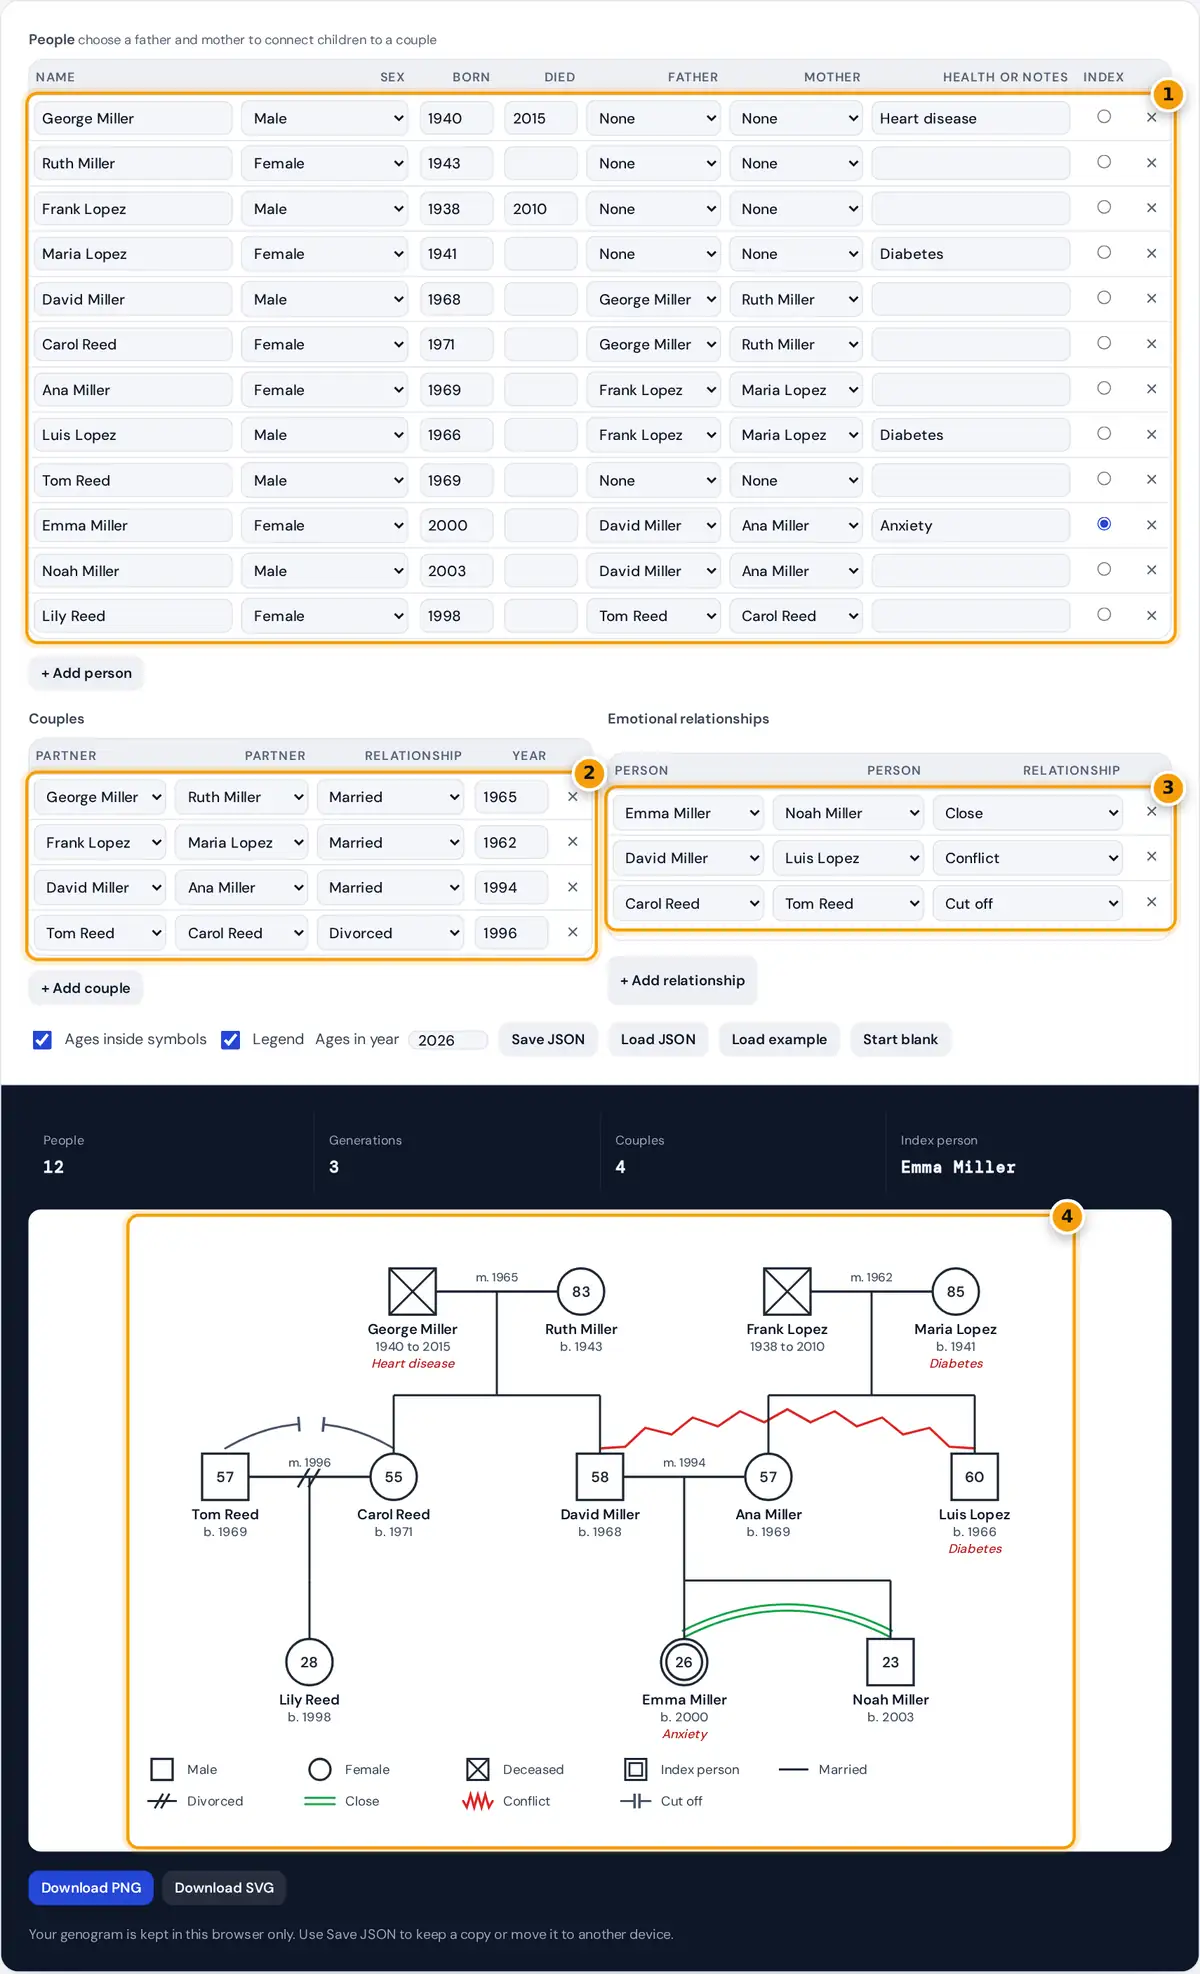
- Enter each person with sex, birth and death years, parents and notes.
- Set each couple's relationship and year.
- Add emotional relationships such as close or conflict.
- Check the genogram, then download it as PNG or SVG.
- The example shows three generations of one family. Press Start blank to begin your own, or edit the example.
- Add each person with + Add person: name, sex, birth year and, if they have died, the death year. Use the notes column for health conditions, occupations or anything else you want under the symbol.
- Choose a father and mother for each child. When both are set, the couple is created automatically and the child hangs from their relationship line, ordered by birth year from left to right.
- In Couples, set each relationship to married, living together, engaged, separated or divorced, and add the year it began. Add couples without children here too.
- Add emotional relationships such as close, conflict, distant or cut off.
- Mark the index person, the person the genogram is about, with the radio button.
- Download the genogram as PNG or SVG, and use Save JSON to keep an editable copy.
Standard Genogram Symbols
The symbols follow the widely used conventions described by Monica McGoldrick and Randy Gerson in their work on genograms in family assessment. Conventions vary a little between textbooks and professions, so check what your course or agency expects.
| Symbol | Meaning |
|---|---|
| Square | Male |
| Circle | Female |
| Diamond | Other gender or unknown |
| X through the symbol | Deceased |
| Double outline | Index person (the client or person of focus) |
| Number inside | Current age, or age in the year you choose |
| Solid horizontal line | Married couple; the year appears above it |
| Dashed line | Living together |
| Dotted line | Engaged |
| One slash | Separated |
| Two slashes | Divorced |
| Vertical lines down to a bar | Children, oldest on the left |
Emotional Relationship Lines
Emotional lines describe how people get along, which is why genograms are used in social work, counseling and family therapy. This maker draws them as curves above the symbols when two people are in the same generation, and as straight lines between generations.
- Close: two parallel green lines. Very close or fused: three lines.
- Distant: a dashed gray line.
- Conflict: a red zigzag line.
- Cut off: a line broken in the middle by two bars.
Worked Example
The example has 12 people in 3 generations. George and Ruth Miller, married in 1965, have two children, David and Carol. Frank and Maria Lopez, married in 1962, have Luis and Ana. David marries Ana in 1994, and their children Emma and Noah form the third generation. Carol was married to Tom Reed in 1996 and is now divorced, so their line shows two slashes, and their daughter Lily still hangs from it. Four couples in total. Emma is the index person, drawn with a double outline. George died in 2015 at 2015 − 1940 = 75, so his square carries an X instead of an age. The ages of living people are calculated as the selected year minus the birth year, for example 2026 − 2000 = 26 for Emma.
partners share a generation; age = chosen year − birth year
What Genograms Are Used For
- Medical family history: patterns of heart disease, diabetes, cancer or mental health conditions across generations. Use the notes column for these.
- Social work and counseling: mapping relationships, separations, conflict and support in a client's family.
- Coursework: nursing, psychology and social work students often draw their own three-generation genogram.
- Genealogy: a compact overview of who married whom and in what order children were born.
Privacy
Family health information is personal. This genogram is drawn in your browser and kept only in this browser's storage on your device. Nothing is uploaded. Use Start blank to clear it, and remove names or use initials before sharing a genogram outside your care team.
Frequently asked questions
What is a genogram?
A genogram is a family diagram that goes beyond a family tree. It uses standard symbols to show at least three generations, marriages and divorces, deaths, health conditions and the emotional quality of relationships.
What do the symbols in a genogram mean?
Squares are males, circles are females and a diamond marks other or unknown gender. An X shows a person has died, a double outline marks the index person, and slashes on a couple line show separation or divorce.
How many generations should a genogram show?
Most genograms show at least three generations: grandparents, parents and the index person's generation with any children. Add more generations when patterns go further back.
How do I show a divorce on a genogram?
Add the couple and set the relationship to Divorced. The maker draws two slashes across their relationship line, and their children remain connected to it below.
Can I add health conditions?
Yes. Type a condition such as diabetes or heart disease in the notes column. It appears in red italic text under the person's name, which makes patterns across generations easy to spot.
Is my family information saved or shared?
It is saved only in your own browser so it is still there when you return. Nothing is uploaded. Use Save JSON for a backup and Start blank to remove it from this browser.