How to Use the Gantt Chart Maker
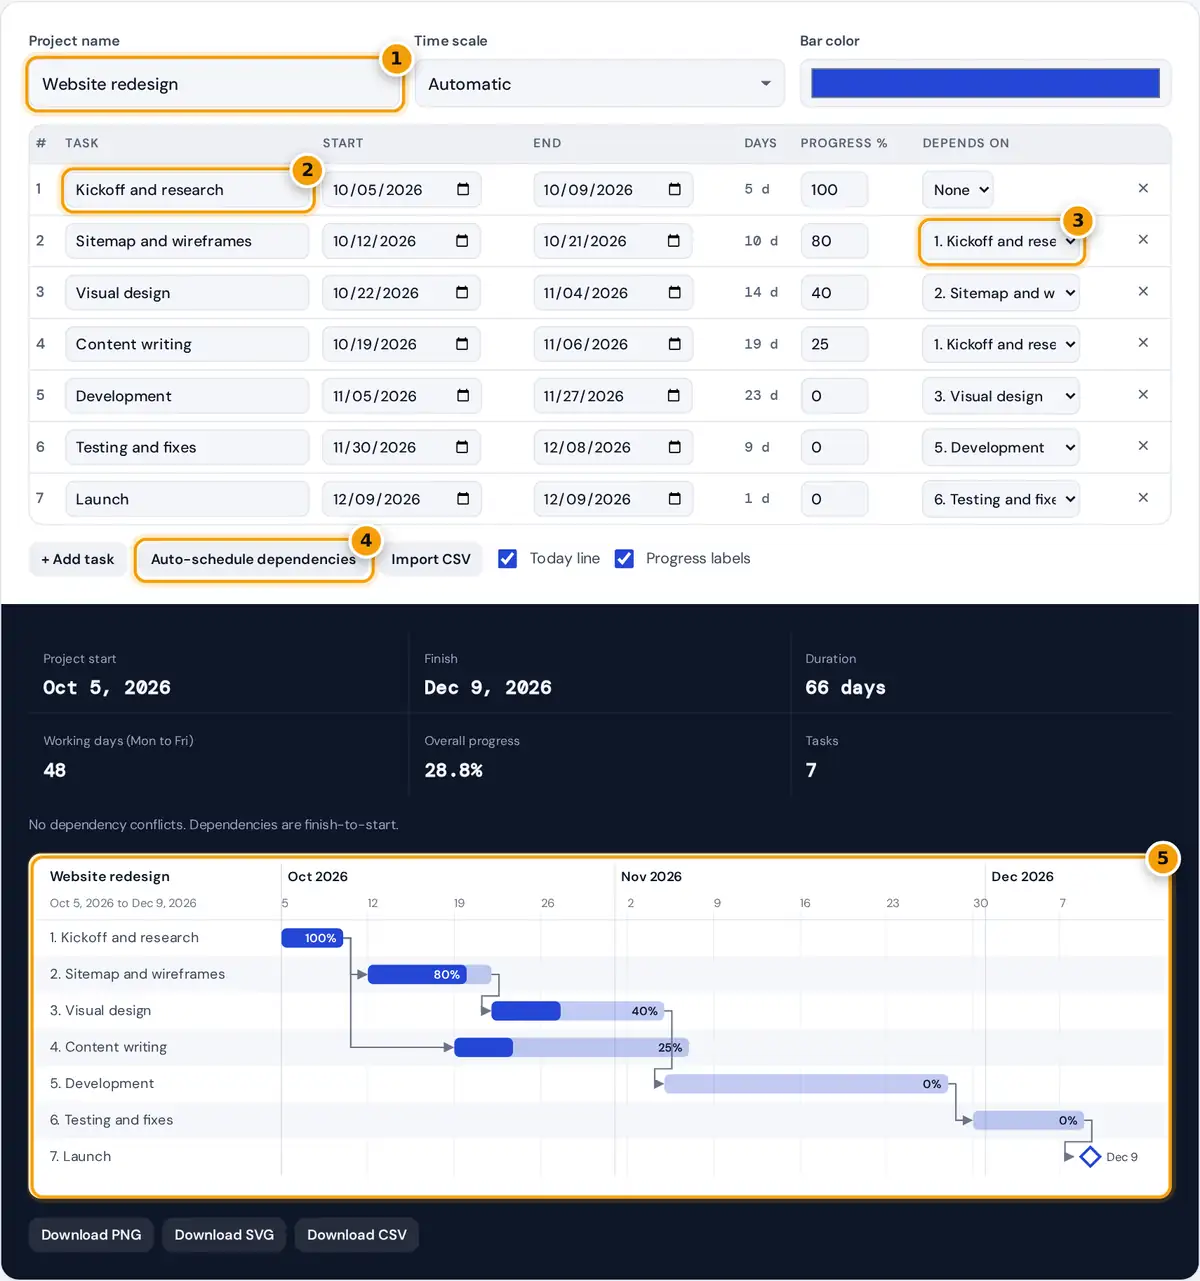
- Name your project, then choose a time scale and bar colour.
- Enter each task's name, start and end date, and progress.
- Set what each task depends on so it starts after the earlier task ends.
- Press Auto-schedule dependencies to shift tasks into a valid order.
- Check the chart, then download it as PNG, SVG or CSV.
Name your project and edit the task table. Each row needs a task name, start date and an end date, and the bar for that task appears on the timeline as soon as you type.
Enter progress as a percentage, and the dark part of each bar shows the work completed. Pick the task each row depends on, and an arrow then links the two bars on the chart automatically.
A red outline warns you when a task starts before its predecessor has finished. Press Auto-schedule dependencies to push any conflicting tasks to the day after their predecessor ends, while keeping each task's original length.
- PNG: for slides and emails.
- SVG: for print or editing in design software.
- CSV: to open the plan in Excel or Google Sheets, or import it here again later.
What a Gantt Chart Shows
A Gantt chart is a bar chart of a schedule. Each task is a row, time runs from left to right, and the length of each bar shows the task duration from start to end.
Henry Gantt popularized the format in the 1910s for factory planning. It remains the standard way to show who does what and when in a project plan, from construction jobs to software and marketing campaigns.
Overlapping bars show work happening in parallel, and arrows show the order in which work must happen. A task whose start and end date are the same is drawn as a diamond, the milestone symbol.
How the Numbers Are Calculated
Dates are inclusive, so a task from Monday to Friday lasts 5 days. Project duration runs from the earliest start to the latest end, and working days count only Monday to Friday in that span.
project duration = latest end − earliest start + 1
working days = weekdays (Monday to Friday) in the project span
overall progress = Σ(duration × progress) ÷ Σ(duration)
Overall progress is weighted by duration, so finishing a 20-day task moves the total more than finishing a 1-day task. This gives a fairer picture of the whole project than a simple unweighted average would.
Dates follow the ISO 8601 date format in the CSV file, written as year, month and day, so spreadsheets in any country or language read them the same way without mixing up months and days.
Worked Example: A Website Redesign
The sample website redesign runs from October 5 to December 9, 2026. That is 27 days in October, 30 in November and 9 in December, so 66 days in total, of which 48 are weekdays.
Kickoff is 5 days at 100%, Wireframes 10 days at 80%, Visual design 14 days at 40% and Content writing 19 days at 25%. The remaining 33 task days are at 0%, giving 28.8% overall.
If the Development task is extended to December 4, Testing now starts before Development ends. Auto-schedule moves Testing to December 5 to 13, keeping its 9 days, and the whole project grows to 71 days.
| Figure | Before | After the change |
|---|---|---|
| Finish date | December 9 | December 14 |
| Project duration | 66 days | 71 days |
| Working days | 48 | 51 |
| Overall progress | 28.8% | 26.5% |
Task Dependencies and Milestones
Dependencies here are finish-to-start, the most common type, where the next task may begin the day after its predecessor ends. Project tools also use start-to-start, finish-to-finish and start-to-finish links for special cases in larger plans.
Each task can have one predecessor, which covers most simple project plans. When one task slips, auto-schedule pushes every dependent task later in a chain, so you see the knock-on effect on the finish date.
Add milestones for decisions and deliveries, such as design sign-off or launch day. Set the start and end date to the same day, and the milestone then appears as a small diamond on the timeline.
Time Scale
The chart picks its time scale automatically from the length of your project. Short plans show every day, medium plans show weeks and long plans show months, so the chart always fits on the screen.
| Scale | Chosen automatically when | Grid |
|---|---|---|
| Days | The project spans 45 days or fewer | One column per day, weekends shaded |
| Weeks | 46 to 240 days | A line every Monday, labeled with the date |
| Months | More than 240 days | Month bands only |
In the days view, weekends are shaded so you can spot tasks that run across a Saturday and Sunday. In the weeks view, a vertical gridline marks every Monday and is labeled with its date.
The SVG export keeps every single bar, label and dependency arrow as sharp vector shapes, following the W3C SVG standard, so the chart prints cleanly at any size and opens neatly in vector design software.
Tips for a Useful Plan
Break work into tasks of a few days to two weeks. Very long bars hide problems until late, while short tasks make progress easy to track and slips easy to see in your weekly review.
Update progress weekly and run auto-schedule again when a task slips. Durations are calendar days, so if your team does not work weekends, end tasks on a Friday and start the next one on Monday.
Use a work breakdown structure to list tasks before you plan dates: split the project into phases, then phases into tasks. A Kanban board suits loose, unordered work much better than a Gantt chart does.
Limits and Privacy
This free Gantt chart maker covers up to 60 tasks with one predecessor each. It does not handle resource loading, critical path calculations or lag times, which full project management software provides for larger teams.
There is no sign-up, watermark or account. Your plan stays in your browser and is not saved between visits, so download the CSV to keep a copy you can import later and continue editing it.
For team collaboration with live editing, comments and workload views, a paid online tool fits better. For a quick, shareable timeline image or a one-off project plan, this simple maker is usually all you need.
Frequently asked questions
Is this Gantt chart maker free?
Yes. There is no sign-up, watermark or account, and you can plan up to 60 tasks. The chart is created entirely in your browser, so nothing is uploaded to a server while you work.
How do I add dependencies?
Choose a task in the Depends on column. The chart draws an arrow from the end of that task to the start of the dependent task, and Auto-schedule moves the dependent task if it starts too early.
Can I open my Gantt chart in Excel?
Download the CSV. It opens in Excel, Google Sheets or Numbers with one row per task, and you can import it back into this tool later to continue editing the plan.
How do I show a milestone?
Set the start and end date to the same day. The task is drawn as a diamond instead of a bar, which is the usual symbol for a launch, deadline or sign-off point.
Are weekends excluded from durations?
No. Durations count calendar days. The Working days figure shows how many Monday to Friday days the whole project covers, so you can compare the calendar span with real working time.
What is the critical path in a Gantt chart?
The critical path is the longest chain of dependent tasks, which sets the earliest possible finish date. This maker does not calculate it, but dependency arrows and auto-schedule show how delays move the finish.