How to Use the Year Over Year Calculator
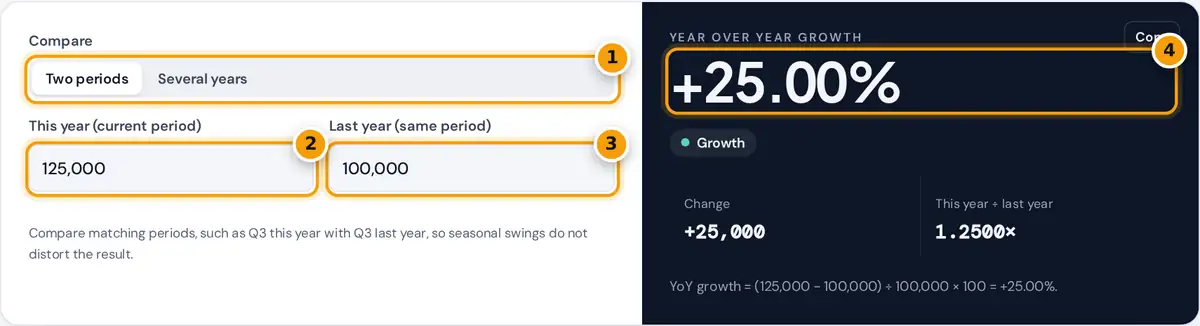
- Compare two periods or analyse several years.
- Enter this year's value.
- Enter last year's value for the same period.
- Read the YoY growth, change and ratio.
Choose Two periods to compare one figure with the same period a year earlier: this year’s revenue with last year’s, this March’s website visits with last March’s, or this quarter’s sales with the same quarter last year. Enter both values and read the YoY growth percentage, the change in units and the ratio between the years.
Choose Several years to analyse a series. Type or paste one year per line with a label and a value, for example “2024, 125000”. The calculator lists the change and YoY percentage for every year, draws a chart of growth and decline, and gives the average YoY growth and the compound annual growth rate. Download the table as a CSV file for a report or spreadsheet.
Year Over Year Growth Formula
CAGR = (last value ÷ first value)1 ÷ years − 1
average YoY = sum of yearly YoY % ÷ number of years
A positive result is growth and a negative result is a decline. When last year’s value is negative, for example a loss, the calculator divides by its absolute value and warns you, because percentage changes from a negative base are easy to misread. A change from zero has no percentage, so only the change in units is shown.
Worked Example
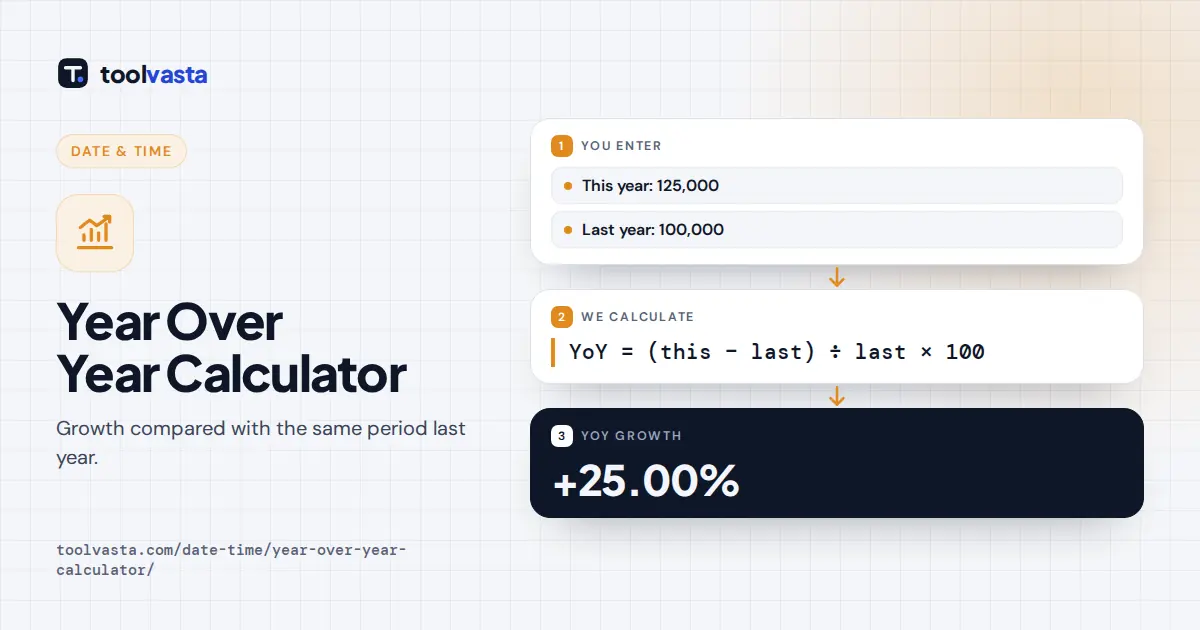
Revenue rose from $100,000 to $125,000. The YoY growth is (125,000 − 100,000) ÷ 100,000 × 100 = +25.00%, a change of +25,000 and a ratio of 1.25.
| Year | Revenue | Change | YoY |
|---|---|---|---|
| 2021 | 82,000 | – | – |
| 2022 | 91,500 | +9,500 | +11.59% |
| 2023 | 100,000 | +8,500 | +9.29% |
| 2024 | 125,000 | +25,000 | +25.00% |
| 2025 | 131,250 | +6,250 | +5.00% |
The average of the four yearly rates is +12.72%. The CAGR is (131,250 ÷ 82,000)1/4 − 1 = +12.48% a year. We confirmed both with a separate script.
Average YoY Growth vs CAGR
The simple average of yearly growth rates overstates the true trend when growth is uneven. A 50% gain followed by a 50% loss averages 0%, yet the value ends 25% lower. CAGR avoids this by asking what single steady rate would turn the first value into the last, so it is the better figure for comparing investments, businesses or markets over several years. Use YoY figures to spot individual good and bad years, and CAGR to summarise the whole period.
Common Uses
- Sales and revenue: the standard way to report growth without seasonal effects.
- Marketing and web traffic: comparing this month’s visits, leads or conversions with the same month last year.
- Economics: inflation is usually reported as the year over year change in a price index, and many statistics agencies publish data this way.
- Personal finance: how your spending, savings or portfolio changed from one year to the next.
Reading YoY Results
A single YoY figure tells you the direction and size of change over twelve months, but it says nothing about what happened in between. A business that grew 10% may have grown steadily or may have dropped sharply and recovered. Look at the series view for context, and compare the latest YoY rate with the average and the CAGR. If the latest rate is well above both, growth is accelerating. If it is below both, growth is slowing even when the figure is still positive.
Tips and Limits
- Compare like with like. A YoY figure for March should compare March with March, not with February.
- Watch for one-off events. A strong year after a weak one shows a large YoY rise that may not continue, an effect analysts call base effects.
- For monthly data that is already seasonally adjusted, month over month changes can be more timely than YoY.
- CAGR needs positive first and last values. When either is zero or negative, use the yearly table instead.
Frequently asked questions
How do you calculate year over year growth?
Subtract last year's value from this year's value, divide by last year's value and multiply by 100. Going from 100,000 to 125,000 is a 25% year over year increase.
What is the difference between YoY and CAGR?
YoY compares one year with the year before it. CAGR is the steady yearly rate that links the first and last year of a longer period, smoothing out the ups and downs in between.
Can year over year growth be negative?
Yes. A negative result means the value fell compared with the same period last year. For example, dropping from 200 to 150 is a year over year change of minus 25%.
How do I calculate YoY growth for a month or quarter?
Use the same formula with the matching period from the previous year, such as July 2026 compared with July 2025, or Q2 2026 compared with Q2 2025.
What if last year's value was zero or negative?
From zero, a percentage change cannot be calculated, so only the change in units is shown. From a negative value, the calculator divides by its absolute value and warns you to interpret the result carefully.
Why is the average YoY growth higher than the CAGR?
A simple average of yearly rates ignores compounding and is pulled up by volatile years. CAGR accounts for compounding, so it is equal to or lower than the average when growth rates vary.