How to Use the Grade Curve Calculator
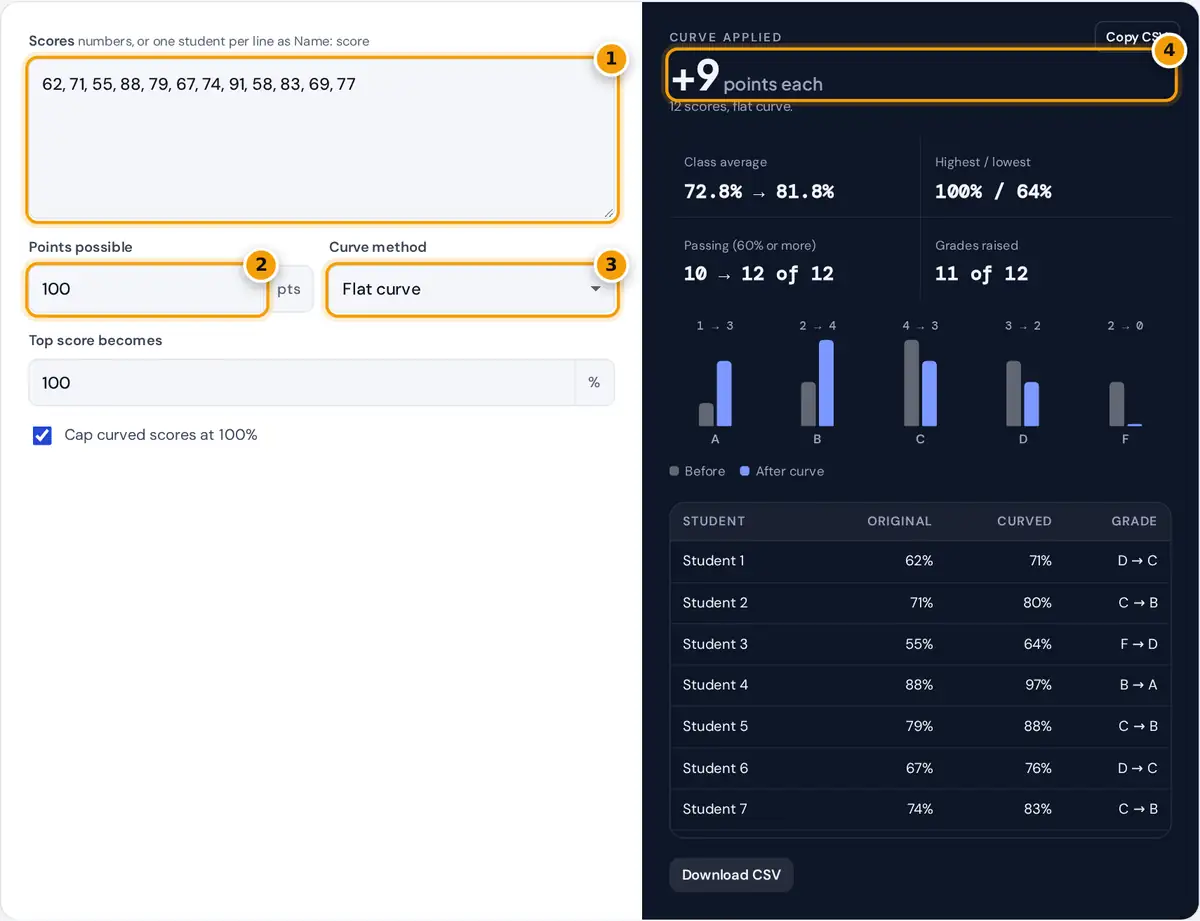
- Paste your class's scores as numbers, or one student per line as Name: score.
- Enter the points the test was out of.
- Choose a curve: flat, add points, shift the average, square root, bell or scale.
- Read the curve applied, then compare averages, grade changes and the student table.
Paste your class's scores into the box. Plain numbers separated by commas, spaces or new lines work, or put one student per line as Name: score so the table keeps their names. Enter the points the test was out of, then choose a curving method and its setting. Every result updates as you type.
The result shows the size of the curve, the class average before and after, the highest and lowest curved scores, how many students pass and how many letter grades went up. A small chart compares the A to F distribution before and after, and the table lists each student's original and curved score. Use Copy CSV or Download CSV to move the results into a spreadsheet or gradebook.
Grade Curving Methods and Formulas
Add points: curved = score + points
Shift average: curved = score + (target average − class average)
Square root: curved % = 10 × √(score %)
Bell curve: curved = target mean + (score − mean) ÷ SD × target SD
Scale: curved % = score % × 100 ÷ highest score %
All methods work in percentages, so a test out of 40 points behaves the same as one out of 100. The bell curve uses the population standard deviation of the scores you entered. Letter grades use the common scale of A at 90%, B at 80%, C at 70% and D at 60%.
Worked Example
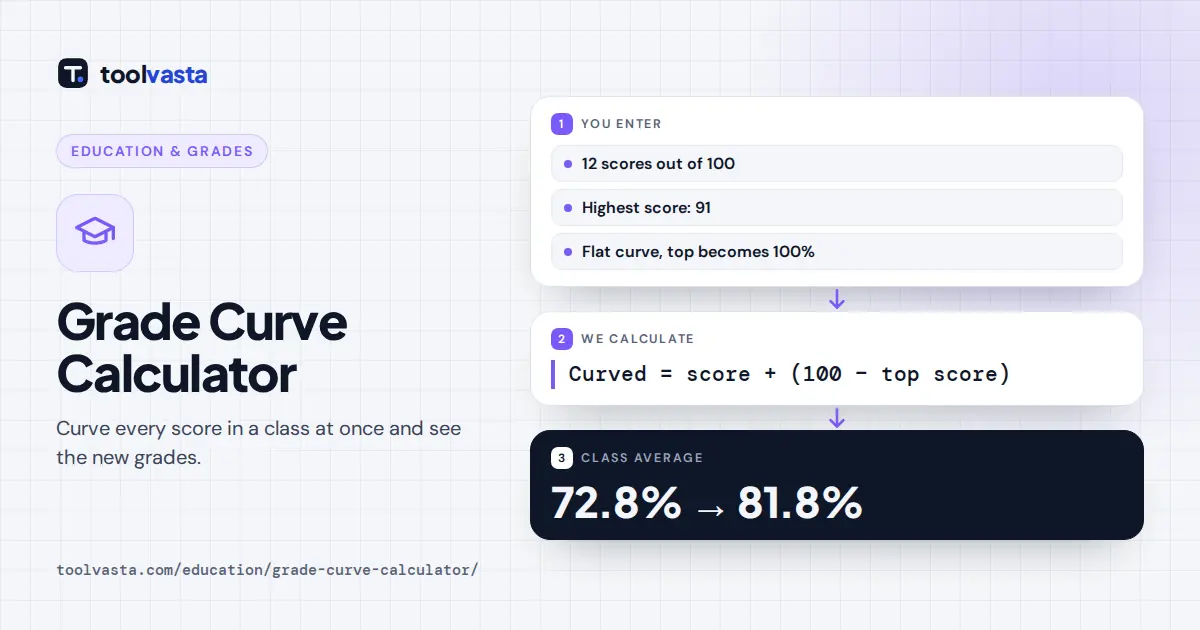
Twelve students scored 62, 71, 55, 88, 79, 67, 74, 91, 58, 83, 69 and 77 out of 100. The average is 72.8% and the top score is 91.
| Method | Change | New average | A / B / C / D / F |
|---|---|---|---|
| No curve | None | 72.8% | 1 / 2 / 4 / 3 / 2 |
| Flat, top to 100% | +9 points each | 81.8% | 3 / 4 / 3 / 2 / 0 |
| Add 5 points | +5 points each | 77.8% | 2 / 3 / 4 / 3 / 0 |
| Average to 75% | +2.17 points each | 75% | 2 / 2 / 4 / 3 / 1 |
| Square root | Largest boost for low scores | 85.1% | 3 / 6 / 3 / 0 / 0 |
| Bell, mean 75, SD 10 | Rescales the spread | 75% | 1 / 3 / 4 / 3 / 1 |
With the square root curve, the lowest score of 55 becomes 74.2% while the top score of 91 becomes 95.4%. The class SD is 10.9 points, so the bell curve with a target SD of 10 slightly narrows the spread as well as raising the average.
Which Curve Should You Use?
- Flat curve: simple and easy to explain. Everyone gains the same points and the ranking does not change.
- Shift the average: useful when a test was harder than planned and you want the class average to match past tests.
- Square root: gives the biggest lift to the lowest scores and almost none to the top, which compresses the range.
- Bell curve: sets both the average and the spread. It can lower some scores if the class did well, so check the table before using it.
- Scale: multiplies every score so the top student reaches 100%, which rewards higher scores slightly more than a flat curve does.
Curving Tests Out of Fewer Points
Enter the points the test was out of, and the calculator converts every score to a percentage before curving. For a quiz out of 40 where five students scored 28, 31, 22, 35 and 19, the top score is 87.5%. A flat curve to 100% adds 12.5 percentage points, which is 5 raw points each. The class average rises from 67.5% to 80%, and the lowest score, 19, becomes 24 out of 40, or 60%.
Limits and Fairness
Curving changes scores, not learning. Explain the method to students before or when you return the test, and apply the same rule to everyone. Check your school's grading policy, because some schools restrict curving or set their own letter grade cutoffs. Scores are processed in your browser only, so student names are not uploaded anywhere.
Frequently asked questions
How do you curve grades on a test?
Pick a method, such as adding the same points to everyone so the top score reaches 100%. Enter the scores and the calculator applies the formula to every student and shows the new letter grades.
What is a flat curve?
A flat curve adds the same number of points to every score. Usually the gap between the highest score and 100% is added, so the top student gets full marks and the ranking stays the same.
How does a square root curve work?
Convert the score to a percentage, take its square root and multiply by 10. A 64% becomes 80%, while an 81% becomes 90%, so lower scores gain the most.
How do you curve grades on a bell curve?
Convert each score to a z-score by subtracting the class mean and dividing by the standard deviation. Then multiply by the target spread and add the target average.
Can curving lower a student's grade?
A flat, add-points or square root curve never lowers a score. A bell curve or a shift to a lower target average can, so review the table before you apply it.
Does a curve change class rankings?
No. All six methods keep students in the same order. They only change the size of the gaps between scores and where those scores land on the letter grade scale.